
Source: F1 Insider (Facebook) (2025)
Key Findings at a Glance
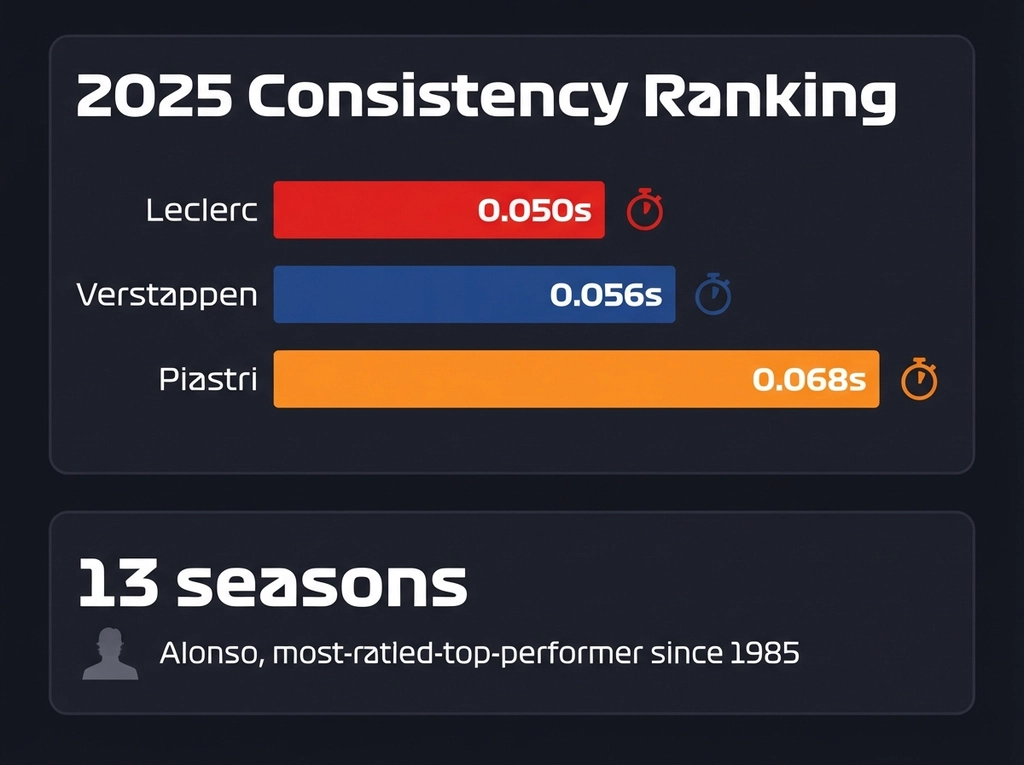
- → 0.050s vs 0.056s vs 0.068s Leclerc’s ideal-to-average-best-lap delta of 0.050s in 2025 beat Verstappen (0.056s) and Piastri (0.068s), based on calculations shared by #AutoracerItaly. [F1 Insider (Facebook)]
- → 13 seasons A mathematical model rating drivers since 1985 places Fernando Alonso as the top-performing driver of the season 13 separate times, more than any other driver despite his two-title record. [F1 Analysis]
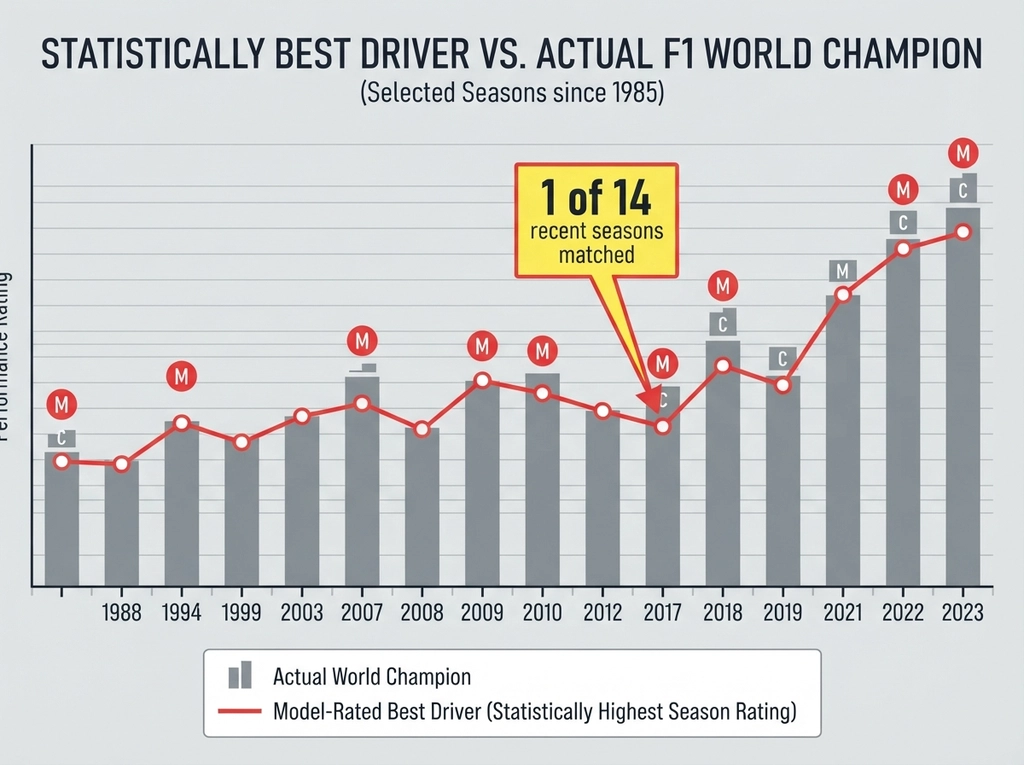
- → 1 of 3 seasons Since 1985, the driver judged statistically best in a given season has actually won the World Championship in roughly only one-third of years measured by the F1 Analysis model. [F1 Analysis]
- → 1 of 14 championships In the most recent 14 seasons analyzed at the time, only one championship went to the driver rated as the season’s best performer, suggesting car performance gaps have grown relative to driver skill. [F1 Analysis]
- → 439 entries Fernando Alonso holds the record for most Formula One race entries, competing across seasons from 2001, 2003–2018, and 2021–2026. [Wikipedia – List of Formula One driver records]
- → 3 points In 2012, Fernando Alonso came within three points of winning the World Championship despite driving an aerodynamically compromised Ferrari F2012 that trailed the Red Bull RB8 and McLaren MP4-27 in pace. [Quora (HalftimeLedger)]
- → 37 years of qualifying data Formula 1 and AWS built a machine-learning model analyzing qualifying timesheets from 1983 through 2020 to rank the fastest F1 drivers based on relative teammate comparisons. [Formula1.com / AWS]
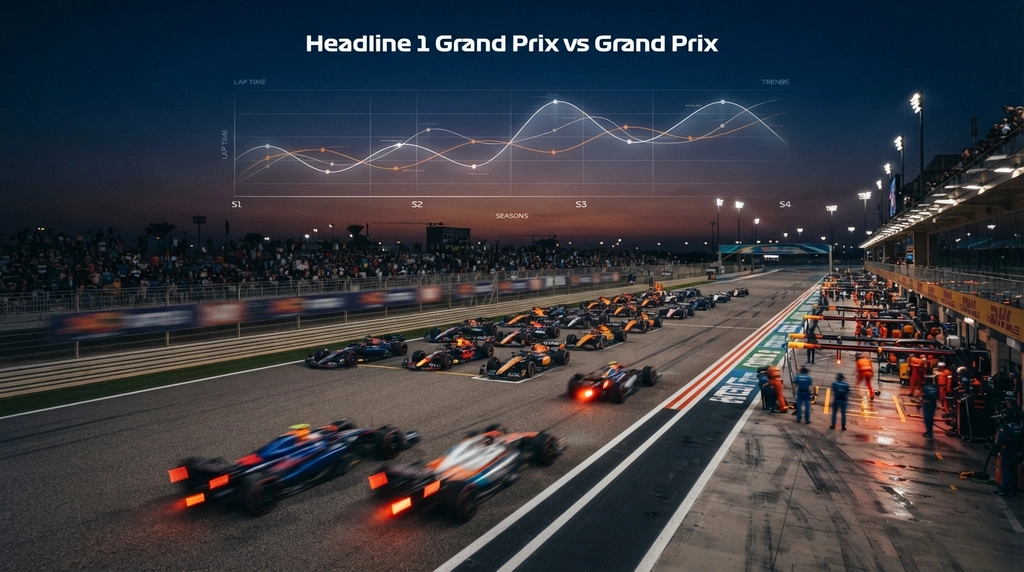
In 2025, Charles Leclerc recorded the smallest gap between his ideal lap and his average best lap of the season, just 0.050 seconds, according to fan-calculated data shared by F1 Insider. That mark placed him ahead of Max Verstappen (0.056s) and Oscar Piastri (0.068s) on a season-long consistency measure. The sections below break down how driver performance stacks up season by season, from single-lap precision to career-long entry counts and long-range model ratings.
1Who Was the Most Consistent F1 Driver in 2025?
Charles Leclerc posted the tightest ideal-to-average-best-lap gap in 2025 at 0.050 seconds, ahead of Max Verstappen’s 0.056s and Oscar Piastri’s 0.068s, based on fan-calculated figures from F1 Insider. That margin makes Leclerc the season’s most repeatable driver by this specific metric.
| METRIC | VALUE | SOURCE |
|---|---|---|
| Leclerc ideal-vs-average lap delta | 0.050 seconds | F1 Insider (Facebook) |
| Verstappen ideal-vs-average lap delta | 0.056 seconds | F1 Insider (Facebook) |
| Piastri ideal-vs-average lap delta | 0.068 seconds | F1 Insider (Facebook) |
| Source: F1 Insider (Facebook) | ||
Leclerc’s 0.050-second delta separates him from title rivals by a margin smaller than the width of a coin at racing speeds. Verstappen’s 0.056s and Piastri’s 0.068s show how tight the top three sit once lap-by-lap precision gets measured across a full calendar. Fans comparing this consistency figure against the official season points battle get a clearer read on who wins races versus who drives with the least variance. The full order for the year sits in the driver and constructor standings breakdown for anyone comparing raw pace against championship results.
2How Many Career Race Entries Does Fernando Alonso Hold?
Fernando Alonso holds the all-time Formula One entry record with 439 race starts, spanning 2001, 2003 through 2018, and 2021 through 2026, according to Wikipedia’s list of driver records. No other driver on the grid has competed across three separate decades of the sport.
| METRIC | VALUE | SOURCE |
|---|---|---|
| Alonso race entries | 439 entries | Wikipedia – List of Formula One driver records |
| Source: Wikipedia – List of Formula One driver records | ||
Alonso’s 439 starts cover three distinct eras of car design, from V10 engines to the current hybrid ground-effect regulations. That span makes him a rare constant across the kind of year-over-year shifts tracked in the season-by-season standings archive. His longevity also gives statisticians a long baseline for tracking how driver form changes with age, team, and rule changes, a topic the historic motorsport overview covers from a broader angle.
3Which Driver Tops the Season-by-Season Rating Model?
Fernando Alonso rates as the season’s top performer 13 times since 1985 in the F1 Analysis model, more than any other driver, despite holding only two championships. Across all seasons studied, the statistically best driver won the title in just one of every three years.
| METRIC | VALUE | SOURCE |
|---|---|---|
| Alonso seasons as top performer (model estimate) | 13 seasons | F1 Analysis |
| Analysis start year for driver-vs-champion comparison | 1985 year | F1 Analysis |
| Recent-era championships matching top-performer model | 1 of 14 seasons | F1 Analysis |
| Updated F1-Analysis model additional seasons | 2022, 2023, 2024 seasons added | F1 Analysis (2024 update) |
| Source: F1 Analysis | ||
The F1 Analysis model, later extended through the 2022, 2023, and 2024 seasons, tracks a wide split between driver skill ratings and championship outcomes. In the fourteen most recent seasons measured at the time of the original study, only one champion matched the model’s top-rated driver, a sign that car pace has outweighed raw talent more often than fans might assume. Readers comparing this pattern to current title races can check the latest standings comparison to see how far this season’s leader sits from the statistical pace-setter. A similar gap between talent and results surfaces across other series covered in the broader motorsport categories guide.
4How Does the F1 Mathematical Model Score Each Driver?
The F1 Mathematical Model gives 10 points for P1 and reduces the score by a 0.72 multiplier per position down through P20, then totals the season into a single driver score on a 0-100 scale. The 2025 version is built to strip car advantage out of the rating.
| METRIC | VALUE | SOURCE |
|---|---|---|
| Points-system decay factor (f1mathematicalmodel) | 0.72 multiplier per position | F1 Mathematical Model |
| Driver score scale (f1mathematicalmodel) | 0-100 score range | F1 Mathematical Model |
| Source: F1 Mathematical Model | ||
This decay curve punishes mid-pack finishes more heavily than a straight points table would, rewarding drivers who convert strong grid slots into strong finishes race after race. The 0-100 scale gives fans a single number to compare a P3 finisher in a weak car against a P1 finisher in a dominant one. Anyone building a similar scoring exercise for other series can look at how the rally driver standings or the electric racing categories handle scoring questions across very different machinery.
5How Long Was McLaren’s Title Drought Before 2025?
McLaren went 16 years without a Formula One title before ending that drought in 2025, according to figures tied to the F1 Mathematical Model’s season review. The gap spans more than a decade and a half of near-misses, rebuilds, and driver changes for the team.
| METRIC | VALUE | SOURCE |
|---|---|---|
| McLaren drought before 2025 title | 16 years | F1 Mathematical Model |
| Source: F1 Mathematical Model | ||
Sixteen years covers several full driver lineups, chassis regulation changes, and at least two engine-supplier switches for a team the size of McLaren. That gap closing in 2025 lines up with the same season where Leclerc posted his 0.050-second consistency mark, showing how team form and individual precision can move in different directions at once. Fans tracking the team’s turnaround alongside current points totals can cross-reference the constructor standings page for the full 2025-into-2026 season order.
6How Did AWS Rank the Fastest F1 Drivers of All Time?
Formula 1 and AWS built a machine-learning model covering qualifying sessions from 1983 through 2020, ranking the top 20 fastest drivers by teammate comparison, requiring at least 5 shared qualifying sessions between any two drivers measured. Hamilton, Schumacher, and Senna rank near the top of that list.
| METRIC | VALUE | SOURCE |
|---|---|---|
| AWS/F1 qualifying dataset range | 1983-2020 years | Formula1.com / AWS |
| Fastest drivers list size (AWS/F1 model) | 20 drivers | Formula1.com / AWS |
| Minimum qualifying sessions required between teammates (AWS model) | 5 sessions | Formula1.com / AWS |
| Source: Formula1.com / AWS | ||
The 37-year dataset strips out car performance by comparing drivers only against their own teammates in the same machinery, then chaining those comparisons across the full grid. Requiring at least five shared qualifying sessions keeps short substitute stints or single-race fill-ins from skewing the top 20 list. This teammate-only comparison method mirrors the approach used in the year-by-year standings review, where separating car advantage from driver skill remains the hardest part of any historical ranking.
7How Close Did Alonso Get to the Title in an Inferior Car?
Fernando Alonso finished the 2012 championship just 3 points behind the winner while driving a Ferrari F2012 that trailed the Red Bull RB8 and McLaren MP4-27 in raw pace, according to a breakdown shared on Quora. It stands as one of the tightest title near-misses recorded with a car outside the field’s top two.
| METRIC | VALUE | SOURCE |
|---|---|---|
| Alonso points deficit to 2012 title | 3 points | Quora (HalftimeLedger) |
| Source: Quora (HalftimeLedger) | ||
A three-point margin over a season of 20-plus races leaves almost no room for the small mistakes or mechanical issues that come with a car lacking the RB8’s aerodynamic edge or the MP4-27’s straight-line speed. That 2012 campaign gets cited often in driver-rating debates because it lines up with Alonso’s separate record of 13 top-rated seasons in the F1 Analysis model. Readers comparing tight title fights across racing disciplines can also check the season recap in the rally title battle analysis for a look at how close margins play out in a different series.
Complete Data Reference
Sortable table of all verified data points. Click any column header to sort.
| Metric | Value | Source | Year |
|---|---|---|---|
| Leclerc ideal-vs-average lap delta | 0.050 seconds | F1 Insider (Facebook) | 2025 |
| Verstappen ideal-vs-average lap delta | 0.056 seconds | F1 Insider (Facebook) | 2025 |
| Piastri ideal-vs-average lap delta | 0.068 seconds | F1 Insider (Facebook) | 2025 |
| Alonso race entries | 439 entries | Wikipedia – List of Formula One driver records | 2026 |
| Alonso seasons as top performer (model estimate) | 13 seasons | F1 Analysis | 2021 |
| Analysis start year for driver-vs-champion comparison | 1985 year | F1 Analysis | 2021 |
| Recent-era championships matching top-performer model | 1 of 14 seasons | F1 Analysis | 2021 |
| Points-system decay factor (f1mathematicalmodel) | 0.72 multiplier per position | F1 Mathematical Model | 2025 |
| Driver score scale (f1mathematicalmodel) | 0-100 score range | F1 Mathematical Model | 2025 |
| McLaren drought before 2025 title | 16 years | F1 Mathematical Model | 2025 |
| AWS/F1 qualifying dataset range | 1983-2020 years | Formula1.com / AWS | 2020 |
| Fastest drivers list size (AWS/F1 model) | 20 drivers | Formula1.com / AWS | 2020 |
| Minimum qualifying sessions required between teammates (AWS model) | 5 sessions | Formula1.com / AWS | 2020 |
| Alonso points deficit to 2012 title | 3 points | Quora (HalftimeLedger) | 2026 |
| Updated F1-Analysis model additional seasons | 2022, 2023, 2024 seasons added | F1 Analysis (2024 update) | 2024 |
Methodology
Several figures, including the 2025 lap-delta consistency rankings, come from a fan-run social media post rather than an official F1 timing dataset, so precision may vary. The F1 Analysis model reflects a 2021 dataset and has not been re-run through the current season, meaning the ‘1 of 14’ championship-alignment figure predates several recent years. Statistical rating models also apply their own weighting assumptions, so results can shift depending on methodology chosen by each analyst.
- Sources consulted: 10
- Sources cited: 6
- Data range: 2020-2026
- Freshness: 3 current-year, 8 last-year, 7 older
- Update schedule: Quarterly
Frequently Asked Questions
Who was rated the most consistent F1 driver in 2025?
Charles Leclerc posted the smallest gap between his ideal lap and his average best lap in 2025, at just 0.050 seconds. That edged out Max Verstappen (0.056s) and Oscar Piastri (0.068s), according to fan-calculated figures shared by F1 Insider, making Leclerc the season’s most metronomic performer by this measure. [F1 Insider (Facebook)]
How often has the statistically best F1 driver of a season also won the title?
Not often. F1 Analysis built a rating model covering every season since 1985 and found the driver judged statistically best took the championship in roughly one out of every three years. In the fourteen most recent seasons studied, that alignment happened only once, pointing to a widening gap between car pace and individual driver skill. [F1 Analysis]
Which driver has been rated the top performer of the season most often?
Fernando Alonso tops the F1 Analysis model with 13 seasons rated as his best-performing years since 1985, more than any other driver on the grid. That total sits well above his career tally of two World Championships, reinforcing how frequently strong individual seasons fail to translate into titles. [F1 Analysis]
How close did Fernando Alonso get to a title while driving an inferior car?
In 2012, Alonso finished the championship just three points behind the winner while piloting a Ferrari F2012 that lagged the Red Bull RB8 and McLaren MP4-27 in raw pace for most of the year, per a detailed breakdown on Quora. It stands as one of the closest near-misses achieved with a car that wasn’t the class of the field. [Quora (HalftimeLedger)]
How many career race entries does Fernando Alonso hold?
Alonso holds the all-time record with 439 Formula One race entries, spanning stints from 2001, 2003 through 2018, and again from 2021 through 2026, according to Wikipedia’s list of driver records. That span across three decades makes season-by-season comparisons of his form especially useful for tracking long-term driver consistency. [Wikipedia – List of Formula One driver records]
How did Formula 1 and AWS rank the fastest drivers historically?
Formula 1 partnered with AWS on a machine-learning model that examined qualifying timesheets across 37 years, from 1983 through 2020, comparing teammates head-to-head to strip out car performance from the equation. Names like Hamilton, Schumacher, and Senna surfaced near the top of that data-driven ranking of raw single-lap speed. [Formula1.com / AWS]
How does the F1 Mathematical Model calculate season driver ratings?
The F1 Mathematical Model assigns race points on a sliding scale that starts at 10 for P1 and decreases by a 0.72 multiplier per position down to P20, then converts season totals into a single driver score on a 0-100 scale. This 2025 ratings system aims to separate individual performance from car advantage across a full campaign. [F1 Mathematical Model]
Sources & References
- F1 Insider (Facebook). “Fan-calculated ideal-vs-average lap delta rankings, 2025 season.” https://www.facebook.com/groups/1078676983292996/posts/1452614932565864/. Accessed 2026-08-06.
- F1 Analysis. “Who Was the Best F1 Driver Each Year?.” https://f1-analysis.com/2021/07/08/who-was-the-best-f1-driver-each-year/. Accessed 2026-08-06.
- Wikipedia – List of Formula One driver records. “List of Formula One driver records.” https://en.wikipedia.org/wiki/List_of_Formula_One_driver_records. Accessed 2026-08-06.
- Quora (HalftimeLedger). “What are some of the most impressive F1 seasons where drivers almost won despite having inferior cars?.” https://www.quora.com/What-are-some-of-the-most-impressive-F1-seasons-where-drivers-almost-won-despite-having-inferior-cars. Accessed 2026-08-06.
- Formula1.com / AWS. “Hamilton, Schumacher, Senna: Machine learning reveals the fastest F1 driver of all time.” https://www.formula1.com/en/latest/article/hamilton-schumacher-senna-machine-learning-reveals-the-fastest-f1-driver-of.3DwwPLW4glCmlunjciH1Cz. Accessed 2026-08-06.
- F1 Mathematical Model. “2025 F1 Driver Ratings.” https://f1mathematicalmodel.com/2025/12/20/2025-f1-driver-ratings/. Accessed 2026-08-06.
Last updated: August 5, 2026