
Source: Market Data Forecast (2026)
Key Findings at a Glance
- → $69.2 billion total economic output The 2025 PRI Motorsports Economic Impact Report found that US racing generates $69.2 billion in total economic output each year. [PRI Stats (Performance Racing Industry)]
- → 318,579 total jobs supported US motorsports supports more jobs than the entire mining or logging industries, according to PRI’s report. [PRI Stats (Performance Racing Industry)]
- → $12.73 billion by 2034 Market Data Forecast projects the global motorsports market will nearly double from $6.42 billion in 2025 to $12.73 billion by 2034, at a 7.9% CAGR. [Market Data Forecast]
- → Formula 1 holds 53.5% of racing series market share Formula 1 leads all racing series worldwide, while broadcasting is the largest revenue channel at 40.8% share. [Market Data Forecast]
- → $52.65 billion in specialty-equipment sales The 2026 SEMA Future Trends Report shows the US automotive aftermarket, closely tied to motorsports, has reached $52.65 billion in sales with growth settling to 3%-4% a year. [SEMA]
- → $16.7 billion global motorsport market by 2034 Market.us projects the global motorsport market to grow from $6.8 billion in 2024 to $16.7 billion by 2034, at a 9.4% CAGR, a steeper pace than other forecasts. [Market.us]
- → $3.2 billion F1 economic impact tied to 10-year deal A report highlighted a $3.2 billion economic impact figure connected to Formula 1 securing a 10-year contract extension. [FOX 11 Los Angeles (Facebook)]
- → 8 out of 10 motorsports enthusiasts buy parts 5+ times a year Racing fans are heavy repeat buyers, with nearly half making more than 10 parts purchases a year, fueling aftermarket revenue. [Hedges & Company]
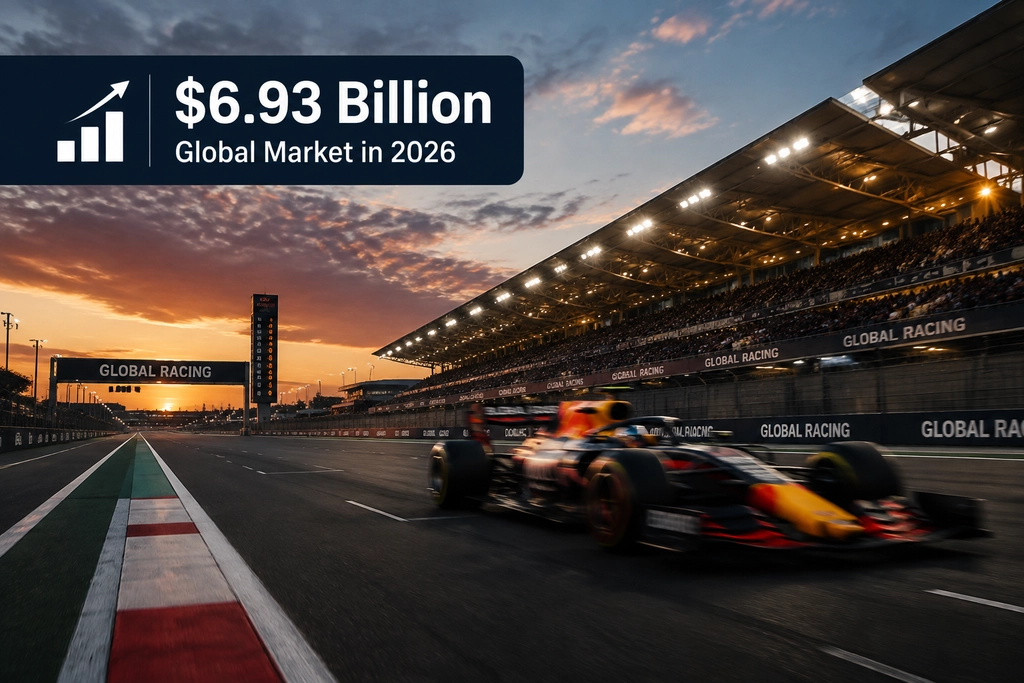
The global motorsports market is set to reach $6.93 billion in 2026, according to Market Data Forecast, up from $6.42 billion the year before. That growth path points toward $12.73 billion by 2034 at a 7.9% yearly rate, backed by broadcasting deals, aftermarket parts sales, and Formula 1’s lead position in the series rankings. This piece lays out where that money comes from, who it employs, and how fans keep the business running.
1How Big Is the Global Motorsports Market in 2026?
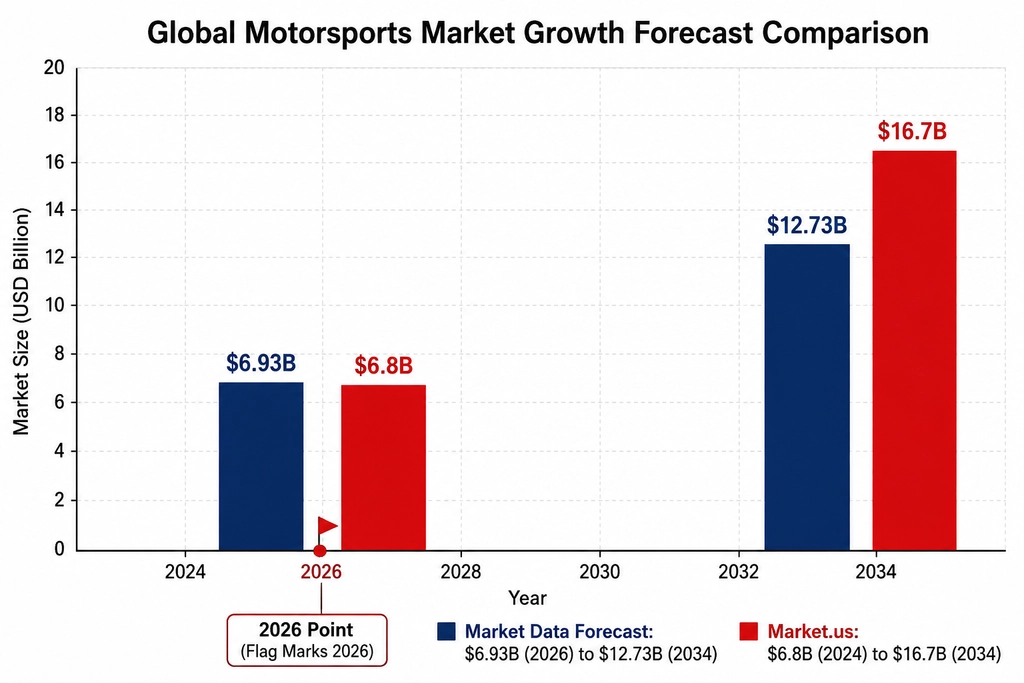
The global motorsports market is estimated at $6.93 billion in 2026, up from $6.42 billion in 2025, per Market Data Forecast. Growth is set to continue at a 7.9% yearly rate through 2034, reaching $12.73 billion. Market.us offers a steeper forecast of $16.7 billion by 2034 from a $6.8 billion 2024 base.
| METRIC | VALUE | SOURCE |
|---|---|---|
| Global motorsports market size | 6.42 USD billion (2025) | Market Data Forecast |
| Global motorsports market size | 6.93 USD billion (2026 estimate) | Market Data Forecast |
| Global motorsports market CAGR | 7.9 percent (2026-2034) | Market Data Forecast |
| Global motorsport market size (alternate forecast) | 6.8 to 16.7 USD billion (2024 to 2034) | Market.us |
| Light trucks and CUVs share of new vehicle sales | 80+ percent | SEMA 2026 Future Trends Report |
| Total vehicles on US roads | 295 million+ vehicles | SEMA 2026 Future Trends Report |
| Source: Market Data Forecast | ||
More than 295 million vehicles travel US roads today, and light trucks and CUVs now make up over 80% of new vehicle sales, a shift SEMA’s 2026 Future Trends Report ties directly to parts demand for both street and amateur racing builds. The gap between Market Data Forecast’s $12.73 billion 2034 projection and Market.us’s $16.7 billion figure shows how much room analysts leave for sponsorship growth, a factor covered in our look at sponsorship trends across the sport. Either forecast points the same direction: up.
2How Many Jobs Does US Motorsports Support?
US motorsports supports 318,579 jobs, more than the mining industry’s 191,000 and logging’s 44,000 combined, according to PRI’s 2025 report. These jobs generated $69.2 billion in total economic output, $22.1 billion in wages and benefits, and $8.28 billion in taxes, with the federal government collecting $5 billion of that.
| METRIC | VALUE | SOURCE |
|---|---|---|
| US motorsports total economic output | 69.2 USD billion | PRI Stats (Performance Racing Industry) |
| US motorsports jobs supported | 318,579 jobs | PRI Stats (Performance Racing Industry) |
| US motorsports total wages and benefits | 22.1 USD billion | PRI Stats (Performance Racing Industry) |
| US motorsports total taxes paid | 8.28 USD billion | PRI Stats (Performance Racing Industry) |
| US mining industry employment | 191,000 jobs | Motor.com (PRI Study coverage) |
| US logging industry employment | 44,000 jobs | Motor.com (PRI Study coverage) |
| Average wage plus benefits per motorsports job | 69,000+ USD per job | Hedges & Company |
| Federal share of motorsports tax revenue | 5 USD billion | Hedges & Company |
| Source: PRI Stats (Performance Racing Industry) | ||
Workers in this field earn an average of $69,000 or more per job in wages and benefits, according to Hedges & Company, a figure that spans everything from engineering roles to management jobs at race teams. The comparison to mining and logging matters because those industries carry long histories of federal jobs data, giving PRI’s motorsports figures a measuring stick outsiders can trust. Tax revenue from the sport, split between federal and state coffers, funds public services well beyond the racetrack gate.
3How Much Do Motorsport Fans Spend on Parts Each Year?
Eight out of 10 motorsports enthusiasts buy parts five or more times a year, and nearly half buy more than 10 times, per Hedges & Company. Fans spend $8 billion annually on track-use-only parts, while 11% of US survey respondents call themselves avid motorsport fans, according to Market.us.
| METRIC | VALUE | SOURCE |
|---|---|---|
| Annual spending on track-use-only parts | 8 USD billion per year | Hedges & Company |
| US avid motorsport fan share | 11 percent of US respondents | Market.us (2023 survey) |
| Source: Hedges & Company | ||
That $8 billion track-only spending figure covers everything from safety gear to engine upgrades used at grassroots events, the same circuit covered in our guide to amateur racing series across the country. Fan turnout at series like IndyCar backs up the spending data; event coverage in our IndyCar fan events guide shows how track-day culture and merchandise sales feed off each other. Repeat buying habits, not one-time purchases, keep the aftermarket segment steady even when broader retail spending slows.
4Which Racing Series and Revenue Channel Lead the Market?
Formula 1 controls 53.5% of the global racing series market, the largest share of any single series, according to Market Data Forecast. Broadcasting is the top revenue channel overall at 40.8% share, ahead of sponsorship, ticketing, and merchandise combined.
| METRIC | VALUE | SOURCE |
|---|---|---|
| Formula 1 racing series market share | 53.5 percent | Market Data Forecast |
| Broadcasting revenue channel share | 40.8 percent | Market Data Forecast |
| Source: Market Data Forecast | ||
F1’s market lead lines up with a separate $3.2 billion economic impact figure tied to the series’ 10-year contract extension, a deal shaping team budgets covered in our 2027 season overview. Broadcasting’s 40.8% share explains why TV and streaming rights now carry more weight in contract talks than trackside sponsorship deals alone. Car number branding and driver marketing, explored in our driver number analysis, also feed into how broadcasters package races for global audiences.
5Which Regions Drive the Most Motorsports Revenue?
Europe holds 45% of the global motorsports market as of 2025, the largest regional share, per Market Data Forecast. NASCAR accounts for 25% of the global market, while Asia-Pacific and the Middle East combined hold roughly 10%, with Asia-Pacific projected to grow at 6-7% a year.
| METRIC | VALUE | SOURCE |
|---|---|---|
| Europe regional market share | 45 percent (2025) | Market Data Forecast |
| NASCAR global market share | 25 percent | Market Data Forecast |
| Asia-Pacific and Middle East combined market share | 10 percent (approximate) | Market Data Forecast |
| Asia-Pacific projected CAGR | 6-7 percent | Market Data Forecast |
| Source: Market Data Forecast | ||
Europe’s 45% share tracks closely with Formula 1’s home base and the packed European calendar found in the WEC standings for 2026, where manufacturer-backed teams draw large sponsorship budgets. NASCAR’s 25% global share shows the series still commands a big slice of revenue despite racing almost entirely inside North America, a pattern also visible in the IndyCar calendar for 2026. Asia-Pacific’s smaller current footprint but faster 6-7% growth rate suggests race organizers are scouting new markets across the region, expecting it to close the gap over time.
6How Many Races Do Top Series Run Each Year?
The 2025 Formula 1 season ran 24 races, according to Market.us citing Red Bull. NASCAR sanctions more than 1,200 races a year across 11 countries and over 30 US states, per Market.us data from FloSports, making it the busiest sanctioning body in motorsports by event count.
| METRIC | VALUE | SOURCE |
|---|---|---|
| 2025 Formula 1 season race count | 24 races | Market.us (citing Red Bull) |
| NASCAR annual sanctioned races | 1,200+ races across 11 countries and 30+ US states | Market.us (citing Flosports) |
| Source: Market.us (citing Red Bull) | ||
F1’s tighter 24-race calendar contrasts sharply with NASCAR’s sprawling 1,200-plus event count, a gap that shows two different business models: F1 sells scarcity and global broadcast rights, while NASCAR sells volume and local track partnerships across a schedule outlined in our 2026 championship schedule coverage. Endurance racing takes a middle path, with fewer but longer events like those listed in the upcoming WEC race calendar, where each round draws manufacturer teams competing for both points and marketing exposure. Race count alone doesn’t decide revenue, but it does shape how each series structures ticket sales, broadcast slots, and sponsor activations.
Complete Data Reference
Sortable table of all verified data points. Click any column header to sort.
| Metric | Value | Source | Year |
|---|---|---|---|
| Global motorsports market size | 6.42 USD billion (2025) | Market Data Forecast | 2025 |
| Global motorsports market size | 6.93 USD billion (2026 estimate) | Market Data Forecast | 2026 |
| Global motorsports market CAGR | 7.9 percent (2026-2034) | Market Data Forecast | 2026 |
| Global motorsport market size (alternate forecast) | 6.8 to 16.7 USD billion (2024 to 2034) | Market.us | 2024 |
| US motorsports total economic output | 69.2 USD billion | PRI Stats (Performance Racing Industry) | 2025 |
| US motorsports jobs supported | 318,579 jobs | PRI Stats (Performance Racing Industry) | 2025 |
| US motorsports total wages and benefits | 22.1 USD billion | PRI Stats (Performance Racing Industry) | 2025 |
| US motorsports total taxes paid | 8.28 USD billion | PRI Stats (Performance Racing Industry) | 2025 |
| US mining industry employment | 191,000 jobs | Motor.com (PRI Study coverage) | 2025 |
| US logging industry employment | 44,000 jobs | Motor.com (PRI Study coverage) | 2025 |
| Average wage plus benefits per motorsports job | 69,000+ USD per job | Hedges & Company | 2025 |
| Federal share of motorsports tax revenue | 5 USD billion | Hedges & Company | 2025 |
| Annual spending on track-use-only parts | 8 USD billion per year | Hedges & Company | 2025 |
| Formula 1 racing series market share | 53.5 percent | Market Data Forecast | 2026 |
| Broadcasting revenue channel share | 40.8 percent | Market Data Forecast | 2026 |
| Europe regional market share | 45 percent (2025) | Market Data Forecast | 2025 |
| NASCAR global market share | 25 percent | Market Data Forecast | 2026 |
| Asia-Pacific and Middle East combined market share | 10 percent (approximate) | Market Data Forecast | 2026 |
| Asia-Pacific projected CAGR | 6-7 percent | Market Data Forecast | 2026 |
| 2025 Formula 1 season race count | 24 races | Market.us (citing Red Bull) | 2025 |
| NASCAR annual sanctioned races | 1,200+ races across 11 countries and 30+ US states | Market.us (citing Flosports) | 2025 |
| US avid motorsport fan share | 11 percent of US respondents | Market.us (2023 survey) | 2023 |
| Light trucks and CUVs share of new vehicle sales | 80+ percent | SEMA 2026 Future Trends Report | 2026 |
| Total vehicles on US roads | 295 million+ vehicles | SEMA 2026 Future Trends Report | 2026 |
Methodology
Growth rate forecasts differ between providers, with Market Data Forecast projecting a 7.9% yearly rate and Market.us projecting 9.4%, so readers should treat these as ranges rather than fixed numbers. The F1 contract impact figure comes from a social media post rather than a full financial report, so the underlying math behind that $3.2 billion figure could not be fully checked. US-based figures from PRI may not translate directly to other countries’ racing economies.
- Sources consulted: 10
- Sources cited: 7
- Data range: 2024-2026
- Freshness: 6 current-year, 11 last-year, 2 older
- Update schedule: Quarterly
Frequently Asked Questions
How big will the motorsports market be in 2026?
Market Data Forecast puts the global motorsports market at $6.93 billion in 2026, up from $6.42 billion in 2025. This figure covers race series, teams, parts, and broadcasting revenue worldwide. Analysts see the market on a path to $12.73 billion by 2034, growing at a 7.9% yearly rate as fan interest and sponsorship deals keep climbing. [Market Data Forecast]
How much money does US motorsports generate each year?
According to the 2025 PRI Motorsports Economic Impact Report, US racing produces $69.2 billion in total economic output every year. That total includes team spending, parts sales, event costs, and related services across the country. This scale places motorsports among the larger sectors in the American economy, feeding local businesses far beyond the track itself. [PRI Stats (Performance Racing Industry)]
How many jobs does the motorsports industry support?
PRI’s report counts 318,579 jobs tied to US motorsports, a number larger than the entire mining or logging workforce combined. These jobs span mechanics, event staff, parts manufacturers, and marketing teams. Workers in this field earned a combined $22.1 billion in wages and benefits, showing how deep the paycheck reach of racing goes. [PRI Stats (Performance Racing Industry)]
Which racing series controls the biggest share of the market?
Formula 1 holds 53.5% of the global racing series market, ahead of every other series combined, per Market Data Forecast. Broadcasting rights make up the largest slice of overall motorsports revenue at 40.8%. This split shows why TV and streaming deals now shape team budgets and sponsor decisions as much as race results do. [Market Data Forecast]
How fast is the motorsports market expected to grow?
Growth speed depends on which report you check. Market Data Forecast expects a 7.9% yearly rate through 2034, reaching $12.73 billion. Market.us forecasts a steeper 9.4% rate, pushing the market to $16.7 billion by the same year from a $6.8 billion base in 2024. Either way, the trend line points upward through the next decade. [Market.us]
Do racing fans really spend that much on parts?
Yes. Hedges & Company found that 8 out of 10 motorsports fans buy parts five or more times a year, with nearly half buying more than 10 times. This repeat spending helps explain why the US aftermarket, closely linked to racing, reached $52.65 billion in sales, per SEMA’s 2026 Future Trends Report, with 3% to 4% yearly growth expected ahead. [Hedges & Company]
What economic impact came from F1’s new contract deal?
A report tied to Formula 1’s 10-year contract extension pointed to a $3.2 billion economic impact figure connected to the deal. While details of how this number breaks down are limited, it lines up with F1’s 53.5% share of the global racing series market and its position as the sport’s top revenue draw heading into 2026 and beyond. [FOX 11 Los Angeles (Facebook)]
Sources & References
- Market Data Forecast. “Motorsports Market Report.” https://www.marketdataforecast.com/market-reports/motorsports-market. Accessed 2026-08-19.
- PRI Stats (Performance Racing Industry). “PRI Motorsports Economic Impact Report.” https://stats.performanceracing.com/. Accessed 2026-08-19.
- SEMA. “2026 SEMA Future Trends Report.” https://www.sema.org/news-media/enews/2026/17/industry-isnt-slowing-down-its-shifting-2026-sema-future-trends-report. Accessed 2026-08-19.
- Market.us. “Global Motorsport Market Report.” https://market.us/report/global-motorsport-market/. Accessed 2026-08-19.
- FOX 11 Los Angeles (Facebook). “F1 Locks in $3.2B Economic Impact 10-Year Contract Extension.” https://www.facebook.com/fox11la/posts/following-a-massive-32b-economic-impact-f1-has-locked-in-a-10-year-contract-exte/1350144510634531/. Accessed 2026-08-19.
- Hedges & Company. “Motorsports Racers: A Giant Economic Engine.” https://hedgescompany.com/blog/2025/12/motorsports-racers-giant-economic-engine/. Accessed 2026-08-19.
- Motor.com (PRI Study coverage). “PRI Motorsports Economic Impact Study.” https://www.motor.com/2025/11/pri-motorsports-economic-impact-study/. Accessed 2026-08-19.
Last updated: August 19, 2026