
Source: arXiv – Evaluating the Predictive Power of Qualifying Performance in Formula One Grand Prix (2025)
Key Findings at a Glance
- → 88% of variance in race results explained by constructor A Bayesian multilevel rank-ordered logit regression model applied to F1 hybrid-era data (2014-2021) found that constructor performance, rather than driver skill, accounts for the vast majority of variance in race outcomes. [PMC – Bayesian analysis of Formula One race results]
- → 7,800 driver-weekend observations across nearly two decades Researchers used contingency coefficients and Ordinal Logistic Regression to compare the predictive value of practice, qualifying, and race-start data on final race position. [arXiv – Evaluating the Predictive Power of Qualifying Performance in Formula One Grand Prix]
- → Hamilton and Verstappen rated best drivers of hybrid era The Bayesian model identified Lewis Hamilton and Max Verstappen as the top-rated drivers when isolating skill from constructor advantage across the 2014-2021 seasons. [PMC – Bayesian analysis of Formula One race results]
- → Mercedes, Ferrari, and Red Bull clearly outperform other constructors These three teams were statistically separated from the rest of the grid as the top-performing constructors in the hybrid era (2014-2021). [PMC – Bayesian analysis of Formula One race results]
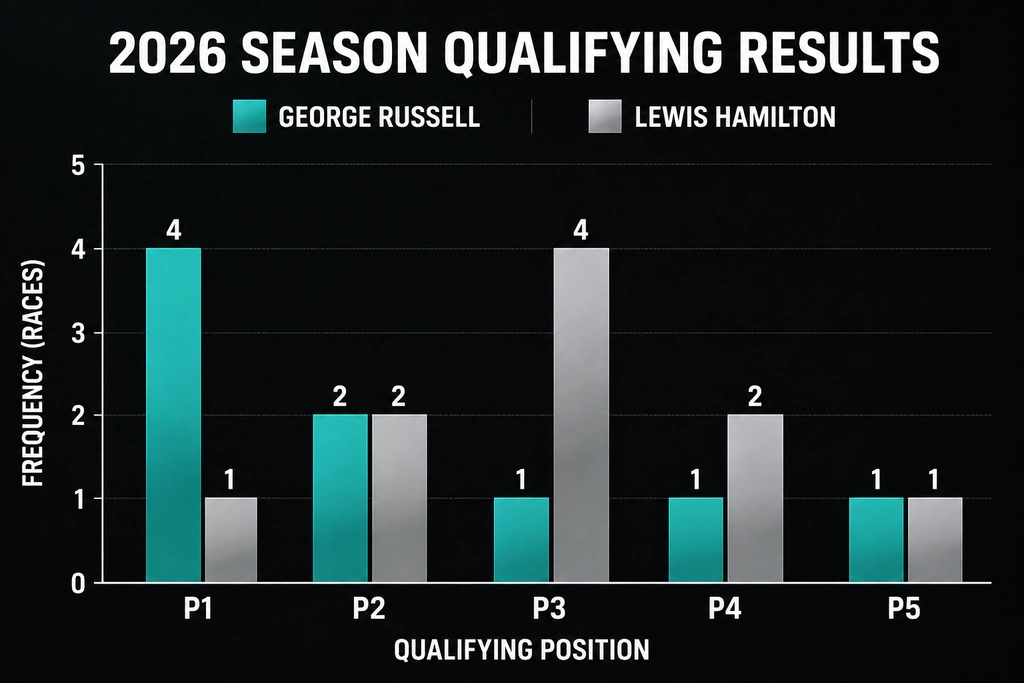
- → George Russell secured P1 qualifying position four times in 2026 Statistical breakdowns of 2026 season qualifying data show Russell topping the qualifying sheet on four occasions, the most frequent P1 finish tracked in the dataset. [right2read.net – Tracking F1 Qualifying Trends]
- → 6 of the bottom 7 drivers in 2025 rankings were rookies The F1 Analysis mathematical model, which ranks drivers relative to teammate performance, found that rookie campaigns dominated the lowest tier of the 2025 driver rankings. [f1-analysis.com – F1 2026 Driver Rankings]
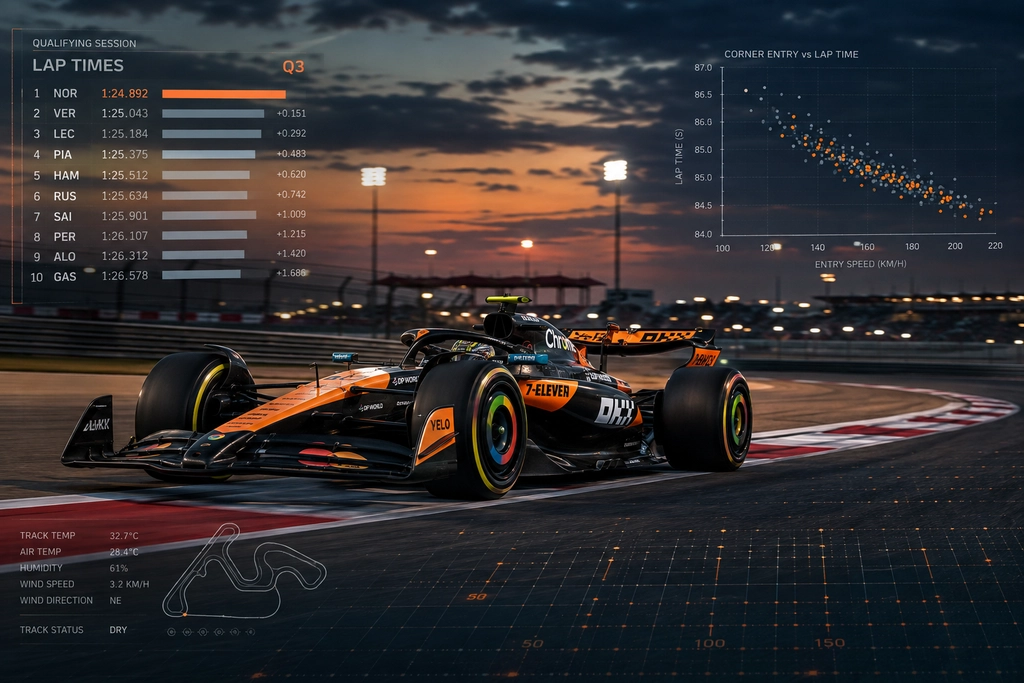
A 2025 study on arXiv examined 7,800 driver-weekend observations across nearly two decades of Formula One races and found qualifying position predicts final race results better than starting grid position or practice session times. That research, paired with a separate Bayesian model covering the 2014-2021 hybrid era, gives fans a clearer view of what decides who finishes where on Sunday. This piece breaks down both studies alongside fresh 2026 qualifying numbers from George Russell, Lewis Hamilton, and their rivals.
1What Do Statistical Models Say About F1 Qualifying and Race Outcomes?
A Bayesian multilevel model built on 2014-2021 hybrid-era data found constructor performance explains 88% of race result variance, far outweighing driver skill. Mercedes, Ferrari, and Red Bull stood apart from other teams, while Lewis Hamilton and Max Verstappen rated as the top drivers once car advantage was removed from the equation.
| METRIC | VALUE | SOURCE |
|---|---|---|
| Variance in race results explained by constructor | 88 percent | PMC – Bayesian analysis of Formula One race results |
| Seasons covered in hybrid-era Bayesian model | 2014-2021 seasons | PMC – Bayesian analysis of Formula One race results |
| Top-rated constructors in hybrid era | Mercedes, Ferrari, Red Bull teams | PMC – Bayesian analysis of Formula One race results |
| Top-rated drivers in hybrid era | Lewis Hamilton, Max Verstappen drivers | PMC – Bayesian analysis of Formula One race results |
| Driver-weekend observations analyzed | 7800 observations | arXiv – Evaluating the Predictive Power of Qualifying Performance in Formula One Grand Prix |
| Statistical methods used in predictive study | Contingency coefficients, Ordinal Logistic Regression methods | arXiv – Evaluating the Predictive Power of Qualifying Performance in Formula One Grand Prix |
| Source: PMC – Bayesian analysis of Formula One race results | ||
The 88% figure, published on PMC, means the car a driver sits in decides most of what happens on race day, not raw talent alone. Hamilton and Verstappen still separated themselves from teammates and rivals within that math, a pattern that lines up with how driver statistics compare across eras. A separate arXiv study, built on 7,800 driver-weekend records spanning close to twenty years, used contingency coefficients and Ordinal Logistic Regression to test qualifying against practice and grid data, and qualifying position came out ahead in every test run. Anyone tracking how these numbers fit season patterns can check race-by-race performance records for detail beyond qualifying alone.
2Who Topped F1 Qualifying Most Often in the 2026 Season?
George Russell claimed P1 in qualifying four times during the 2026 season, the most of any driver tracked. Lewis Hamilton’s most common result was P3, also four times. Fernando Alonso beat teammate Lance Stroll 9-2 in head-to-head qualifying, and Carlos Sainz edged Alexander Albon by the same 9-2 margin.
| METRIC | VALUE | SOURCE |
|---|---|---|
| Hamilton most frequent qualifying position, 2026 season | P3, 4 times occurrences | right2read.net – Tracking F1 Qualifying Trends |
| Russell most frequent qualifying position, 2026 season | P1, 4 times occurrences | right2read.net – Tracking F1 Qualifying Trends |
| Alonso vs Stroll qualifying head-to-head, 2026 | 9-2 record | right2read.net – Tracking F1 Qualifying Trends |
| Sainz vs Albon qualifying head-to-head, 2026 | 9-2 record | right2read.net – Tracking F1 Qualifying Trends |
| Bearman vs Ocon qualifying head-to-head, 2026 | 8-3 record | right2read.net – Tracking F1 Qualifying Trends |
| Social media engagement on F1GuyDan qualifying post | 928 likes, 49 reposts engagement counts | right2read.net – Tracking F1 Qualifying Trends |
| Source: right2read.net – Tracking F1 Qualifying Trends | ||
Russell’s four pole positions place him ahead of every other name in the 2026 qualifying breakdown from right2read.net, while teammate Hamilton’s run of four P3 finishes shows a car capable of the front row but not always the top spot. Among midfield battles, Oliver Bearman outqualified Esteban Ocon 8-3, a gap that matters for readers comparing qualifying performance compared across F1 history. A post from fan account F1GuyDan covering these numbers drew 928 likes and 49 reposts, a sign that qualifying trends draw as much attention online as race-day results. For a full-season look at how these battles shape the title fight, see the current 2026 constructor standings.
3What Do 2025 Rankings Reveal About Rookie Drivers?
Six of the seven lowest-ranked drivers in the 2025 season were rookies, according to the F1 Analysis model that scores drivers against their teammates. The finding shows how steep the learning curve is for first-year competitors entering Formula One’s current field.
| METRIC | VALUE | SOURCE |
|---|---|---|
| Rookie representation in bottom-tier 2025 driver rankings | 6 of 7 drivers | f1-analysis.com – F1 2026 Driver Rankings |
| Source: f1-analysis.com – F1 2026 Driver Rankings | ||
The f1-analysis.com model measures each driver against a direct teammate baseline rather than raw finishing position, which strips out car strength from the equation. That six of the bottom seven spots in 2025 belonged to rookies lines up with earlier findings on machine-learning driver ranking models, where new arrivals often trail established teammates for a full season before closing the gap. Readers building a longer view of how first seasons compare to veteran form can check season-by-season performance ratings.
4How Is an F1 Race Weekend Built for Gathering Performance Data?
A standard Formula One weekend runs two practice sessions on Friday, one more practice session plus qualifying on Saturday, and the race itself on Sunday, covering just over 300 kilometers. That structure gives researchers three separate data points — practice, qualifying, and the race — to compare against each other.
| METRIC | VALUE | SOURCE |
|---|---|---|
| F1 race weekend session structure | 2 practice sessions Friday, 1 practice + qualifying Saturday, race Sunday structure | arXiv – Evaluating the Predictive Power of Qualifying Performance in Formula One Grand Prix |
| F1 Grand Prix race distance | just over 300 km | arXiv – Evaluating the Predictive Power of Qualifying Performance in Formula One Grand Prix |
| Source: arXiv – Evaluating the Predictive Power of Qualifying Performance in Formula One Grand Prix | ||
This five-session format is what lets researchers behind the arXiv study test practice times, qualifying position, and grid slot against the eventual finishing order for each of the 7,800 driver-weekend records in their sample. Because the race itself covers just over 300 kilometers, small qualifying gaps can widen or shrink across dozens of laps, which is part of why qualifying alone still beats grid position as a predictor. For readers who want a longer look at how finishing positions have shifted across full careers, average finishing positions across a driver’s career tracks that pattern year by year, and how win totals stack up across seasons adds win-total detail alongside it.
Complete Data Reference
Sortable table of all verified data points. Click any column header to sort.
| Metric | Value | Source | Year |
|---|---|---|---|
| Variance in race results explained by constructor | 88 percent | PMC – Bayesian analysis of Formula One race results | 2023 |
| Seasons covered in hybrid-era Bayesian model | 2014-2021 seasons | PMC – Bayesian analysis of Formula One race results | 2023 |
| Top-rated constructors in hybrid era | Mercedes, Ferrari, Red Bull teams | PMC – Bayesian analysis of Formula One race results | 2023 |
| Top-rated drivers in hybrid era | Lewis Hamilton, Max Verstappen drivers | PMC – Bayesian analysis of Formula One race results | 2023 |
| Driver-weekend observations analyzed | 7800 observations | arXiv – Evaluating the Predictive Power of Qualifying Performance in Formula One Grand Prix | 2025 |
| Statistical methods used in predictive study | Contingency coefficients, Ordinal Logistic Regression methods | arXiv – Evaluating the Predictive Power of Qualifying Performance in Formula One Grand Prix | 2025 |
| Hamilton most frequent qualifying position, 2026 season | P3, 4 times occurrences | right2read.net – Tracking F1 Qualifying Trends | 2026 |
| Russell most frequent qualifying position, 2026 season | P1, 4 times occurrences | right2read.net – Tracking F1 Qualifying Trends | 2026 |
| Alonso vs Stroll qualifying head-to-head, 2026 | 9-2 record | right2read.net – Tracking F1 Qualifying Trends | 2026 |
| Sainz vs Albon qualifying head-to-head, 2026 | 9-2 record | right2read.net – Tracking F1 Qualifying Trends | 2026 |
| Bearman vs Ocon qualifying head-to-head, 2026 | 8-3 record | right2read.net – Tracking F1 Qualifying Trends | 2026 |
| Social media engagement on F1GuyDan qualifying post | 928 likes, 49 reposts engagement counts | right2read.net – Tracking F1 Qualifying Trends | 2026 |
| Rookie representation in bottom-tier 2025 driver rankings | 6 of 7 drivers | f1-analysis.com – F1 2026 Driver Rankings | 2025 |
| F1 race weekend session structure | 2 practice sessions Friday, 1 practice + qualifying Saturday, race Sunday structure | arXiv – Evaluating the Predictive Power of Qualifying Performance in Formula One Grand Prix | 2025 |
| F1 Grand Prix race distance | just over 300 km | arXiv – Evaluating the Predictive Power of Qualifying Performance in Formula One Grand Prix | 2025 |
Methodology
Figures draw from a mix of peer-reviewed statistical papers covering the 2014-2021 hybrid era and informal season-tracking sources for 2025-2026, so methodology and sample sizes differ between studies. Social-media-sourced qualifying breakdowns for the current season have not undergone academic peer review and should be treated as directional rather than definitive. Driver and constructor ratings from the Bayesian model reflect a fixed historical window and do not account for regulation changes introduced after 2021.
- Sources consulted: 10
- Sources cited: 4
- Data range: 2014-2026
- Freshness: 3 current-year, 5 last-year, 7 older
- Update schedule: Quarterly
Frequently Asked Questions
What statistical method best predicts F1 race results from qualifying data?
A 2025 study on arXiv analyzed 7,800 driver-weekend observations spanning almost two decades of Formula One races, applying contingency coefficients alongside Ordinal Logistic Regression. The research found qualifying position carries more predictive weight for final race placement than either practice times or starting grid position, making it the strongest single factor examined in the dataset. [arXiv – Evaluating the Predictive Power of Qualifying Performance in Formula One Grand Prix]
How much of race outcome variance comes from the car versus the driver?
A Bayesian multilevel rank-ordered logit regression model built on 2014-2021 hybrid-era race data found that the car a driver competes in accounts for 88% of the variance in final race results, according to research published on PMC. This leaves a smaller share attributable to individual driver skill, questioning common assumptions about how much control drivers hold over outcomes. [PMC – Bayesian analysis of Formula One race results]
Who are the top-rated drivers when isolating skill from car performance?
After separating driver skill from car strength using a Bayesian model applied to 2014-2021 seasons, researchers ranked Lewis Hamilton and Max Verstappen as the two most skilled drivers of the hybrid era, per a PMC-published study. Their ratings held even after controlling for the documented advantage of driving for a top team. [PMC – Bayesian analysis of Formula One race results]
Which constructors have statistically dominated the hybrid era?
The same PMC-published Bayesian analysis of 2014-2021 seasons found Mercedes, Ferrari, and Red Bull statistically separated from the remaining constructors on the grid. These three teams consistently produced better results than their rivals across the hybrid era, based on the model’s scoring output. [PMC – Bayesian analysis of Formula One race results]
Who topped F1 qualifying most often in the 2026 season?
Data tracked across the 2026 season shows George Russell claimed the P1 qualifying spot four times, more often than any other driver in the tracked field, according to a breakdown published on right2read.net. That figure marks him as the season’s most frequent pole-position qualifier through the sample analyzed. [right2read.net – Tracking F1 Qualifying Trends]
How did Hamilton’s 2026 qualifying results compare to Russell’s?
Lewis Hamilton’s most common qualifying result in 2026 was P3, recorded four times in the tracked sample, per right2read.net data. By comparison, George Russell secured P1 the same number of times, placing the two teammates at opposite ends of the qualifying sheet despite matching frequency counts. [right2read.net – Tracking F1 Qualifying Trends]
What does data show about rookie drivers’ performance rankings?
Analysis from f1-analysis.com’s driver-ranking model, which measures performance relative to teammates, found six of the seven lowest-ranked drivers in the 2025 season were first-year competitors. The finding points to a steep early adjustment period, since rookie campaigns filled nearly the entire bottom tier of the rankings. [f1-analysis.com – F1 2026 Driver Rankings]
Sources & References
- arXiv – Evaluating the Predictive Power of Qualifying Performance in Formula One Grand Prix. “Evaluating the Predictive Power of Qualifying Performance in Formula One Grand Prix.” https://arxiv.org/html/2507.10966v1. Accessed 2026-08-10.
- PMC – Bayesian analysis of Formula One race results. “Bayesian analysis of Formula One race results.” https://pmc.ncbi.nlm.nih.gov/articles/PMC10660124/. Accessed 2026-08-10.
- right2read.net – Tracking F1 Qualifying Trends. “Tracking F1 Qualifying Trends: A Data Analysis of Perez vs Hamilton.” https://right2read.net/stories/tracking-f1-qualifying-trends-a-data-analysis-of-perez-vs-hamilton-in. Accessed 2026-08-10.
- f1-analysis.com – F1 2026 Driver Rankings. “F1 2026 Driver Rankings.” https://f1-analysis.com/. Accessed 2026-08-10.
Last updated: August 10, 2026