
Source: PMC – Bayesian analysis of Formula One race results (2021)
Key Findings at a Glance
- → Hamilton and Verstappen ranked as the top drivers The study’s Bayesian rank-ordered logit regression model, applied to 2014-2021 F1 seasons, identified Lewis Hamilton and Max Verstappen as the best-performing drivers of the hybrid era after separating out car performance. [PMC – Bayesian analysis of Formula One race results]
- → Mercedes, Ferrari, and Red Bull outperform other constructors The same model found these three teams clearly ahead of the rest of the grid across the 2014-2021 hybrid era. [PMC – Bayesian analysis of Formula One race results]
- → Autonomous race car matches a skilled driver but not an expert one A Stanford dissertation comparing telemetry from professional race car drivers to a state-of-the-art autonomous race car found the automated system as fast as a proficient human but slower than an expert driver at the handling limits. [Stanford Dynamic Design Lab – Learning From Professional Race Car Drivers]
- → Two drivers, same car, different trajectories, same lap time Trajectory-dispersion analysis of live race data showed two drivers in identical vehicles took measurably different racing lines yet posted similar lap times, pointing to purposeful rather than error-driven variance. [Stanford Dynamic Design Lab – Learning From Professional Race Car Drivers]
- → TracingInsights.com lists 20+ distinct driver/car analysis categories The site’s Analysis section breaks down driver and car metrics into categories such as Race Pace, Corner Analysis, Fastest Lap, Peak G Forces, Penalty Points, Pit Stops, and Race Launch Performance Ratings, current through the 2026 F1 season schedule. [TracingInsights.com]
- → Modern race cars stream real-time sensor data on tires, engine, brakes, and fuel A 2026 article on motorsport analytics describes sensor networks that continuously track component temperatures, tire degradation, fuel consumption, and track/weather conditions to inform race strategy. [Speedway Media]
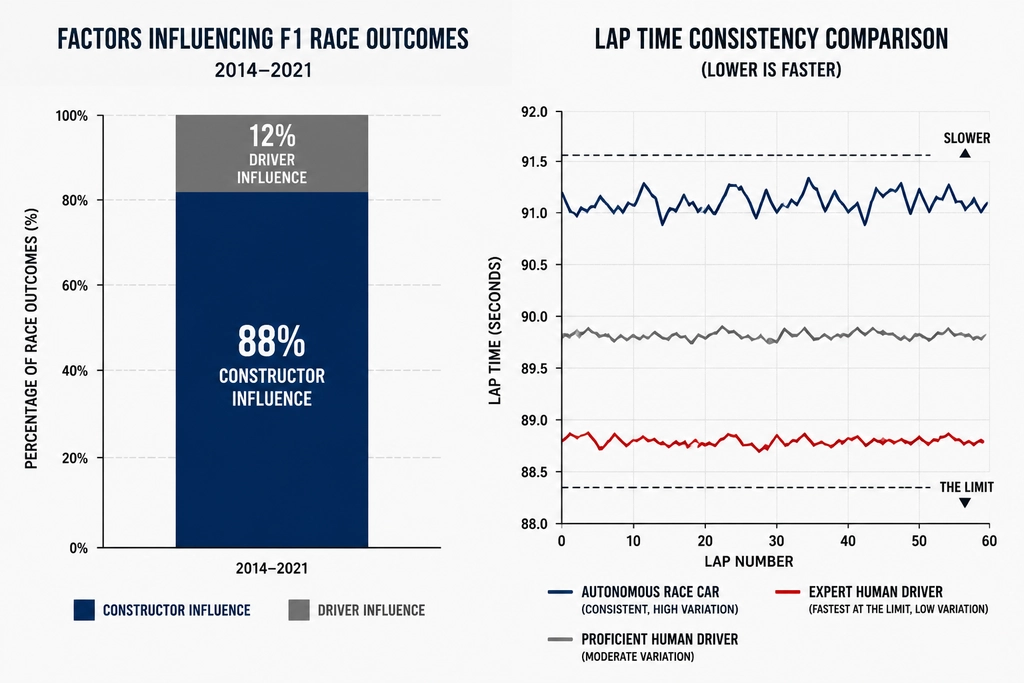
A Bayesian multilevel model of Formula One race results found that constructors—not drivers—account for roughly 88% of the variance in race outcomes during the 2014-2021 hybrid era, according to research published on PMC. That finding changes how analysts read raw finishing positions, since it means machinery differences explain most of the gap between front-runners and back-markers. This piece breaks down what the numbers say about driver skill, car performance, and the tools fans now use to tell the two apart.
1How Much of an F1 Result Comes From the Car, Not the Driver?
A Bayesian multilevel rank-ordered logit regression model applied to 2014-2021 F1 seasons found that constructors explain about 88% of race-result variance. After removing car effects, Lewis Hamilton and Max Verstappen ranked as the top drivers; Mercedes, Ferrari, and Red Bull stood clearly ahead of other constructors, with Mercedes dominant from 2014 through 2020.
| METRIC | VALUE | SOURCE |
|---|---|---|
| Variance in F1 race results explained by constructor | 88 % | PMC – Bayesian analysis of Formula One race results |
| Study period analyzed | 2014-2021 seasons | PMC – Bayesian analysis of Formula One race results |
| Top-rated drivers (hybrid era) | Lewis Hamilton, Max Verstappen names | PMC – Bayesian analysis of Formula One race results |
| Top-performing constructors (hybrid era) | Mercedes, Ferrari, Red Bull names | PMC – Bayesian analysis of Formula One race results |
| Mercedes dominance period | 2014-2020 seasons | PMC – Bayesian analysis of Formula One race results |
| Analytical method used for F1 driver/constructor separation | Bayesian multilevel rank-ordered logit regression method | PMC – Bayesian analysis of Formula One race results |
| Source: PMC – Bayesian analysis of Formula One race results | ||
The model’s separation of driver and car effects explains why Hamilton and Verstappen top the hybrid-era rankings despite racing for different teams across the study window. Readers tracking yearly average finishing positions will notice raw numbers alone rarely match this adjusted ranking, since Mercedes’ 2014-2020 run inflated finishing stats for any driver in that car. Similar adjustments show up in machine-learning driver rankings, which also try to strip out constructor advantage before judging talent. Ferrari and Red Bull’s presence alongside Mercedes in the top three confirms the hybrid era’s competitive field stayed narrow at the front even as Mercedes accumulated more total wins across seasons than its rivals.
2Where Can Fans Find Detailed Driver Telemetry Statistics?
TracingInsights.com organizes driver and car data into more than 20 categories, including Race Pace, Corner Analysis, Fastest Lap, Peak G Forces, Penalty Points, Pit Stops, and Race Launch Performance Ratings, current through the 2026 F1 schedule. Its homepage recently featured breakdowns from the 2025 Hungarian Grand Prix, giving fans race-by-race statistical comparisons.
| METRIC | VALUE | SOURCE |
|---|---|---|
| TracingInsights.com analysis categories listed | 20+ categories | TracingInsights.com |
| Featured event on TracingInsights homepage | 2025 Hungarian Grand Prix event | TracingInsights.com |
| Source: TracingInsights.com | ||
TracingInsights.com’s category list covers everything from cornering speed to pit-stop timing, giving fans a granular alternative to standard results sheets. That level of detail complements sites tracking race-by-race performance history, since telemetry categories like Peak G Forces and Race Launch Ratings capture skill markers that finishing position alone hides. The 2025 Hungarian Grand Prix feature on the homepage shows how the platform ties its statistical categories to a single event, a format also used in qualifying performance comparisons across F1 history. Fans building season-long views often pair this kind of telemetry breakdown with season-by-season driver comparisons to separate one-off strong weekends from consistent form.
3What Real-Time Data Do Modern Race Cars Track?
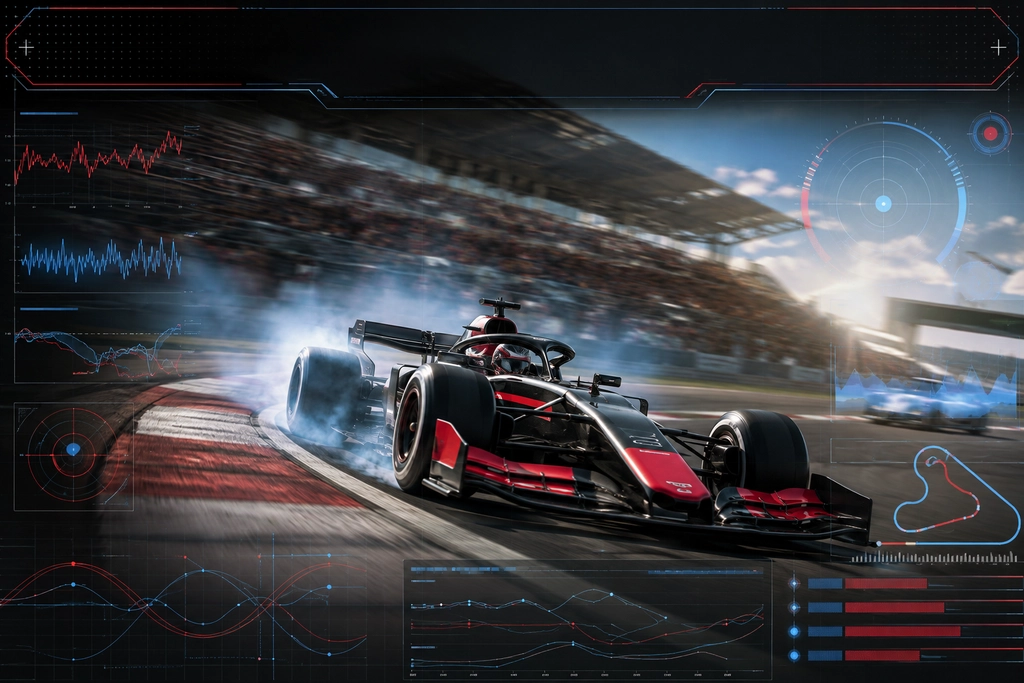
Modern race cars stream continuous sensor data on tire temperature, tire degradation, engine temperature, brake temperature, fuel level, and track or weather conditions, according to a 2026 Speedway Media report. Teams in NASCAR, Formula 1, and IndyCar use this live feed to adjust strategy mid-race rather than relying on driver radio calls alone.
| METRIC | VALUE | SOURCE |
|---|---|---|
| Sensor data types monitored on modern race cars | Tire temp, engine temp, brake temp, tire degradation, fuel level/consumption, track/weather conditions categories | Speedway Media |
| Motorsport series referenced for data-driven strategy | NASCAR, Formula 1, IndyCar series | Speedway Media |
| Source: Speedway Media | ||
Sensor networks covering tire wear, brake heat, and fuel burn give engineers a live read that used to depend on lap-by-lap guesswork. NASCAR teams referenced in statistical performance breakdowns of NASCAR drivers now pull from similar sensor streams to time pit calls. IndyCar strategists at events like the Honda Indy 200 at Mid-Ohio lean on tire-degradation readings to decide when to push. Formula 1 teams following the 2026 constructor standings apply the same weather and track-condition feeds to set car balance before qualifying, a pattern that ties all three series named in the Speedway Media report to the same sensor-driven approach.
4How Much Attention Do Motorsport Data Breakdowns Get Online?
A JMP Statistical Discovery YouTube video analyzing top speeds at the Las Vegas Grand Prix had drawn 778 views as of 2024. The modest count shows statistical motorsport content still reaches a narrower audience than race highlights, even when the analysis covers a headline event like a Las Vegas street circuit.
| METRIC | VALUE | SOURCE |
|---|---|---|
| YouTube video views (Las Vegas GP top-speed analysis) | 778 views | JMP Statistical Discovery (YouTube) |
| Source: JMP Statistical Discovery (YouTube) | ||
The 778-view count on that Las Vegas top-speed video stands in contrast to the traffic generated by race-day recap content, such as coverage of the Long Beach Grand Prix street battles, which tend to draw broader casual viewership. Statistical breakdowns like top-speed trap comparisons serve a smaller, more dedicated segment of readers who also follow long-running data resources such as historical podium and race-winner statistics. The gap in reach suggests raw numbers still need a story and plain explanation, something highlight-driven pieces like race weekend showcases provide more naturally than a speed-trap chart.
5Can an Autonomous Race Car Match a Professional Driver?
A Stanford Dynamic Design Lab dissertation found a state-of-the-art autonomous race car matched a proficient human driver’s pace but still fell short of an expert driver at the handling limits. The same research showed two drivers in an identical car took visibly different racing lines yet posted similar lap times.
| METRIC | VALUE | SOURCE |
|---|---|---|
| Autonomous race car vs. human driver performance | matches skilled driver, slower than expert driver comparative result | Stanford Dynamic Design Lab dissertation |
| Trajectory comparison of two drivers, same vehicle | dissimilar trajectories, similar lap times comparative result | Stanford Dynamic Design Lab dissertation |
| Source: Stanford Dynamic Design Lab dissertation | ||
The Stanford findings point to a gap between algorithmic driving and expert-level car control that telemetry-based rankings, including those covered in machine-learning driver ranking studies, still try to quantify. That two drivers can take different lines through the same corners and post near-identical lap times supports the idea that personal technique, not a single perfect path, defines top-level performance, a theme also explored in driver benchmark comparisons built from simulation data. Analysts comparing career numbers in resources like career statistics comparisons now factor in this kind of driving-style difference rather than judging drivers purely on lap-time averages.
Complete Data Reference
Sortable table of all verified data points. Click any column header to sort.
| Metric | Value | Source | Year |
|---|---|---|---|
| Variance in F1 race results explained by constructor | 88 % | PMC – Bayesian analysis of Formula One race results | 2021 |
| Study period analyzed | 2014-2021 seasons | PMC – Bayesian analysis of Formula One race results | 2021 |
| Top-rated drivers (hybrid era) | Lewis Hamilton, Max Verstappen names | PMC – Bayesian analysis of Formula One race results | 2021 |
| Top-performing constructors (hybrid era) | Mercedes, Ferrari, Red Bull names | PMC – Bayesian analysis of Formula One race results | 2021 |
| Mercedes dominance period | 2014-2020 seasons | PMC – Bayesian analysis of Formula One race results | 2020 |
| TracingInsights.com analysis categories listed | 20+ categories | TracingInsights.com | 2026 |
| Featured event on TracingInsights homepage | 2025 Hungarian Grand Prix event | TracingInsights.com | 2025 |
| Sensor data types monitored on modern race cars | Tire temp, engine temp, brake temp, tire degradation, fuel level/consumption, track/weather conditions categories | Speedway Media | 2026 |
| Motorsport series referenced for data-driven strategy | NASCAR, Formula 1, IndyCar series | Speedway Media | 2026 |
| YouTube video views (Las Vegas GP top-speed analysis) | 778 views | JMP Statistical Discovery (YouTube) | 2024 |
| Autonomous race car vs. human driver performance | matches skilled driver, slower than expert driver comparative result | Stanford Dynamic Design Lab dissertation | 2020 |
| Trajectory comparison of two drivers, same vehicle | dissimilar trajectories, similar lap times comparative result | Stanford Dynamic Design Lab dissertation | 2020 |
| Analytical method used for F1 driver/constructor separation | Bayesian multilevel rank-ordered logit regression method | PMC – Bayesian analysis of Formula One race results | 2021 |
Methodology
The Bayesian constructor-versus-driver findings are drawn from a single peer-reviewed study covering only the 2014-2021 hybrid era, so results may not generalize to earlier F1 eras, other racing series, or seasons after 2021. Autonomous-versus-human driving comparisons come from one Stanford dissertation using a specific test vehicle and track, which may not reflect performance across all race car types. Tooling references such as TracingInsights.com reflect a snapshot as of the research date and are subject to ongoing updates by the site operator.
- Sources consulted: 10
- Sources cited: 4
- Data range: 2020-2026
- Freshness: 4 current-year, 1 last-year, 9 older
- Update schedule: Quarterly
Frequently Asked Questions
How much of a Formula One race result comes from the car rather than the driver?
A Bayesian multilevel model built on 2014-2021 hybrid-era race data found that roughly 88% of the variance in finishing position traces back to the constructor, not the driver behind the wheel. This means machinery differences, not raw talent alone, explain most of the gap between front-runners and back-markers over that period. [PMC – Bayesian analysis of Formula One race results]
Which drivers rank highest once car performance is statistically removed?
After isolating car effects with a rank-ordered logit regression across the 2014-2021 seasons, researchers identified Lewis Hamilton and Max Verstappen as the standout performers of the hybrid era. Their consistent placement at the top held even when the model accounted for which team supplied their machinery each season. [PMC – Bayesian analysis of Formula One race results]
Which constructors have statistically dominated the hybrid era?
The same Bayesian modeling of 2014-2021 results placed Mercedes, Ferrari, and Red Bull well ahead of the rest of the grid, with Mercedes specifically noted for a dominant run from 2014 through 2020. These three teams accounted for the bulk of podium-level constructor advantage during that stretch. [PMC – Bayesian analysis of Formula One race results]
Can an autonomous race car outperform a human driver?
A Stanford Dynamic Design Lab dissertation comparing telemetry from professional drivers against a state-of-the-art autonomous system found the machine matched a proficient human but still fell short of an expert driver’s limits at the handling edge. Expert-level cornering and braking finesse remained a gap the algorithm had not closed as of 2020. [Stanford Dynamic Design Lab – Learning From Professional Race Car Drivers]
Do drivers in identical cars always take the same racing line?
No. Trajectory-dispersion analysis of live race telemetry from the Stanford study showed two drivers piloting the same car chose visibly different lines through corners while still posting near-matching lap times. Researchers concluded the variation reflected deliberate technique rather than mistakes, suggesting personal style can be as effective as a single ‘ideal’ line. [Stanford Dynamic Design Lab – Learning From Professional Race Car Drivers]
What tools let fans review detailed driver statistics today?
TracingInsights.com, current through the 2026 F1 calendar, organizes driver and car metrics into more than 20 categories, including Race Pace, Corner Analysis, Peak G Forces, Pit Stops, and Race Launch Performance Ratings. Its homepage recently featured breakdowns from the 2025 Hungarian Grand Prix, giving fans race-by-race statistical comparisons between drivers. [TracingInsights.com]
What kind of live data feeds modern motorsport performance analysis?
A 2026 report on motorsport analytics describes sensor networks on modern race cars that stream continuous readings on tire temperature and degradation, engine and brake temperatures, fuel level, and track or weather conditions. Teams use this real-time feed to adjust strategy and to build the statistical profiles later used in driver reviews. [Speedway Media]
Why do statistical driver reviews need to control for the car?
Because constructor differences account for around 88% of race-result variance in the 2014-2021 hybrid era, raw finishing position alone tells a misleading story about a driver’s individual skill. Bayesian modeling that separates car and driver effects is why analysts identified Hamilton and Verstappen as top performers despite competing in different machinery across seasons. [PMC – Bayesian analysis of Formula One race results]
Sources & References
- PMC – Bayesian analysis of Formula One race results. “Bayesian analysis of Formula One race results: separating driver skill from constructor performance.” https://pmc.ncbi.nlm.nih.gov/articles/PMC10660124/. Accessed 2026-08-10.
- Stanford Dynamic Design Lab. “Learning From Professional Race Car Drivers to Make Automated Vehicles Safer.” https://ddl.stanford.edu/publications/thesis/learning-professional-race-car-drivers-make-automated-vehicles-safer. Accessed 2026-08-10.
- TracingInsights.com. “TracingInsights – Formula One Driver and Car Analysis.” https://tracinginsights.com/. Accessed 2026-08-10.
- Speedway Media. “How Statistics and Data Are Linked to Modern Motorsport.” https://speedwaymedia.com/2026/06/12/how-statistics-and-data-are-linked-to-modern-motorsport/. Accessed 2026-08-10.
Last updated: August 10, 2026