
Statistical Analysis of NASCAR Drivers’ Performance
Statistical analysis of NASCAR drivers’ performance shows Denny Hamlin leading the 2026 Cup Series with 886 points, built on measurable gaps in wins, laps led, and career consistency.
Key Takeaways
- Denny Hamlin leads the 2026 Cup Series standings with 886 points, 84 ahead of Tyler Reddick’s 802 (Racing-Reference, 2026)
- Only 83 caution flags have flown through 13 races of 2026, the lowest count at this stage since 2012 (NASCAR.com, 2026)
- Toyota drivers led laps in 9 of the first 13 races of 2026, though Chevrolet answered with four straight wins (NASCAR.com, 2026)
- Jeff Gordon’s career win rate of 11.55% more than doubles Bill Elliott’s 5.31% across similar career start totals (frcs.pro, 2026)
- Ryan Blaney has 19 wins and 5,613 laps led across 400 career Cup starts, ahead of A.J. Allmendinger’s 3 wins in 504 starts (Racing-Reference, 2026)
- Justin Allgaier leads the O’Reilly Auto Parts Series with 1,016 points (Racing-Reference, 2026)
- The 2026 Brickyard 400 carried a total purse of $11,233,037 (Jayski.com, 2026)
What Does Statistical Analysis of NASCAR Drivers’ Performance Actually Measure?
Statistical analysis of NASCAR drivers’ performance turns race weekends into numbers that show who wins, how often, and by how much. Analysts track wins, top-5 and top-10 finishes, laps led, average start and finish position, and pole counts across single seasons and full careers.
These numbers come from tracking sources like Racing-Reference and NASCAR.com, then get lined up against manufacturer trends, pit-road speed, and caution-flag counts to build a fuller picture of who is winning and why. The method works much like machine learning-based driver rankings in other racing series, where a single finish position rarely tells the whole story.
A number on its own means little. Denny Hamlin’s 886-point total in the 2026 Cup Series standings only carries weight next to the drivers chasing him.
Who Leads the 2026 NASCAR Cup Series Standings by the Numbers?
Denny Hamlin leads the 2026 NASCAR Cup Series standings with 886 points, per Racing-Reference (2026). Tyler Reddick sits second with 802 points, and Ryan Blaney holds third with 766 points as the field pushes past the season’s midpoint.
The rest of the top 10 reads: Ty Gibbs (751), Carson Hocevar (638), Chase Elliott (635), Chase Briscoe (623), Kyle Larson (617), Chris Buescher (613), and Christopher Bell (609), from the same Racing-Reference data set. The 84-point margin between Hamlin and Reddick is one of the widest first-to-second gaps at this stage of a recent Cup season.
One level down, Justin Allgaier leads the O’Reilly Auto Parts Series with 1,016 points (Racing-Reference, 2026), a total that puts him well clear of the second-tier field heading into the summer stretch.
How Do Caution Flags and Manufacturer Speed Shape a Season’s Stats?
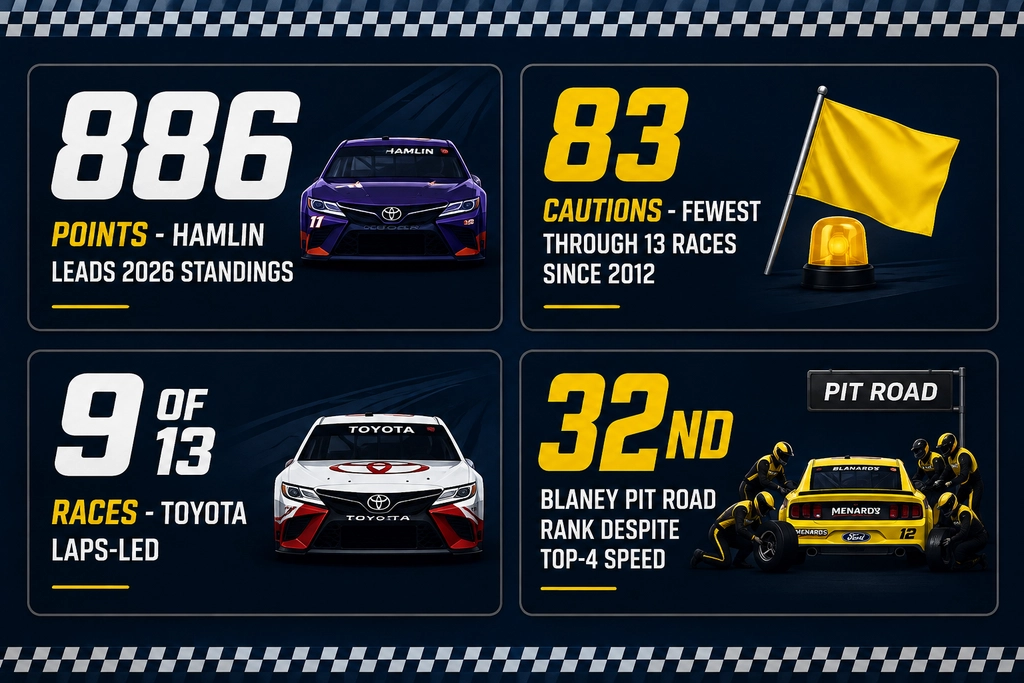
Caution flags and manufacturer speed shape a season’s stats as much as raw wins do. Through the first 13 races of 2026, only 83 caution flags flew, the lowest count at this stage of a season since 2012, per NASCAR.com.
Toyota drivers led the most laps in 9 of those 13 races, yet Chevrolet answered with four straight wins, a split that shows raw pace and race-day results don’t always land with the same manufacturer (NASCAR.com, 2026).
Ryan Blaney’s No. 12 team shows the same split on a smaller scale. It ranks among the top four teams in speed and passing metrics but sits 32nd on pit road, a gap that shows pit-crew execution can quietly cost or gain spots across a full season.
How Do Active Drivers Compare Across Career Statistics?
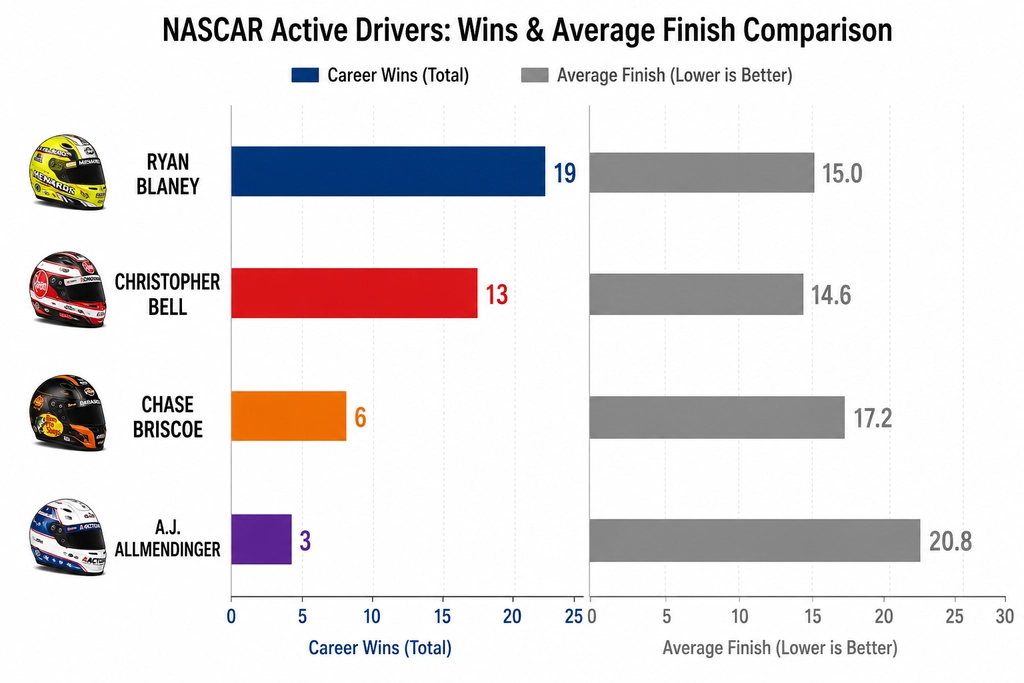
Active drivers compare best when their career totals sit side by side. Ryan Blaney has made 400 career Cup starts with 19 wins, 100 top-5 finishes, 183 top-10 finishes, and 5,613 laps led, for an average finish of 15.0, per Racing-Reference’s Active NASCAR Driver Stats (2026).
Christopher Bell has fewer starts at 238 but a tighter average finish of 14.6, with 13 wins and 3,139 laps led. A.J. Allmendinger, with 504 starts, has just 3 wins and a 20.8 average finish, and Chase Briscoe sits between the two groups with 6 wins across 202 starts. The table below lines up all four side by side.
Bell’s average finish beats Blaney’s on 162 fewer starts, a pattern seen when career stat comparisons in other series show win rate and finish consistency don’t always scale with the number of races run.
| Driver | Career Starts | Wins | Top-5 | Top-10 | Poles | Laps Led | Avg Finish |
|---|---|---|---|---|---|---|---|
| Ryan Blaney | 400 | 19 | 100 | 183 | 14 | 5,613 | 15.0 |
| Christopher Bell | 238 | 13 | 68 | 117 | 15 | 3,139 | 14.6 |
| Chase Briscoe | 202 | 6 | 37 | 60 | 9 | 1,587 | 17.5 |
| A.J. Allmendinger | 504 | 3 | 23 | 90 | 5 | 709 | 20.8 |
How Do Legendary Drivers Compare Historically?
Jeff Gordon’s win rate separates him from nearly every other Cup driver in NASCAR history. Gordon won 93 of his 805 career starts, an 11.55% win rate, more than double Bill Elliott’s 5.31% mark from 44 wins in 828 starts, per the frcs.pro Driver Head-to-Head Tool (2026).
Gordon’s laps-led total of 24,936 dwarfs Elliott’s 11,413, yet Elliott made more career starts at 828 versus 805. Gordon also out-poled Elliott, 89 to 55, over a shorter career.
Elliott’s average finish of 16.40 sits nearly four spots behind Gordon’s 12.51, a gap that shows how average finish over a full career can separate two drivers with a similar number of starts. This kind of side-by-side breakdown mirrors how win totals get compared across eras in single-seater record books.
What Does the Brickyard 400 Data Show About Track and Purse Trends?
The 2026 Brickyard 400 carried a total purse of $11,233,037, run July 26 at Indianapolis Motor Speedway as the 22nd of 36 races on the season schedule, per Jayski.com (2026).
The track’s qualifying record still belongs to Kevin Harvick, who ran 188.889 mph over 47.647 seconds back in 2014. The race record belongs to Bobby Labonte, who averaged 155.912 mph to win in 2 hours, 33 minutes, and 56 seconds back in 2000 (Jayski.com).
The first Cup race at Indianapolis Motor Speedway ran on August 6, 1994, and Jeff Gordon won it, leading 93 of 160 laps at an average speed of 131.977 mph. Three decades of purse growth and speed records at the same track give analysts a long run of numbers to measure against modern V8-powered stock cars, a comparison point similar to how engine performance across decades gets tracked in other motorsport histories.
Is There Peer-Reviewed Research on Predicting NASCAR Race Outcomes?
Peer-reviewed research on NASCAR outcomes does exist, though it’s rare next to the volume of academic work on stick-and-ball sports. A 2008 study published in The Sport Journal analyzed 14 races from the 2003 Winston Cup season, testing variables like pole position, qualifying speed, practice time, team size, and prior-year points to see which factors best predicted finishing order.
The study remains one of the few formal attempts to model NASCAR results with statistics rather than opinion. Its approach lines up with newer season-based driver milestone tracking, which tests similar pre-race variables against actual finish data across much larger samples of races.
How Does NASCAR Statistical Analysis Compare to Other Motorsport Data Models?
NASCAR’s statistical analysis leans on many of the same building blocks used across other motorsport series, even if the specific numbers differ. Formula 1 analysts track season-by-season performance ratings, and World Rally Championship analysts use a points-based scoring system built around stage times instead of laps led.
What sets NASCAR apart is the weight given to laps led and average finish over a full 36-race season, since one crash or caution can erase a strong points day. Cup Series analysts lean too on manufacturer-level splits, such as Toyota’s 9-of-13 laps-led mark in 2026, that don’t have a direct match in single-manufacturer series.
Frequently Asked Questions
Who leads the 2026 NASCAR Cup Series points standings?
Denny Hamlin holds the top spot in the 2026 NASCAR Cup Series standings with 886 points, ahead of Tyler Reddick (802) and Ryan Blaney (766) as the field heads into the Iowa Corn 350. This gap reflects a season where steady finishes across 13-plus races have separated the top three from the rest of the pack (Racing-Reference).
How many caution flags have flown during the 2026 Cup Series regular season?
Through the first 13 races of 2026, only 83 caution flags have flown, the lowest total at this point in a season since 2012. The number points to a year marked by clean racing and fewer race-altering incidents compared with recent seasons (NASCAR.com).
Which manufacturer has been fastest in the 2026 season, and does that match win totals?
Toyota drivers led the most laps in 9 of the first 13 races of 2026, showing clear pace advantages. Chevrolet, though, converted that gap differently, stringing together four straight wins, proving raw speed and race-day results don’t always align in the same manufacturer’s favor (NASCAR.com).
Why does Ryan Blaney’s team rank so differently in speed versus pit road?
Blaney’s No. 12 team ranks among the top four in speed and passing metrics for 2026, yet sits 32nd overall on pit road. This split shows how pit-crew execution, rather than car pace alone, can quietly cost or gain positions across a season, a factor often missed in surface-level standings breakdowns (NASCAR.com).
How does Ryan Blaney’s career record compare to other active drivers?
Across 400 career Cup starts, Ryan Blaney has 19 wins, 100 top-5 finishes, and 5,613 laps led, with an average finish of 15.0. That places him ahead of veterans like A.J. Allmendinger, who has 3 wins and a 20.8 average finish over 504 starts, showing how win rate and finish consistency don’t always scale with experience (Racing-Reference).
How does Jeff Gordon’s win rate compare to Bill Elliott’s?
Jeff Gordon won 93 of his 805 career starts, a rate of 11.55%, more than double Bill Elliott’s 5.31% from 44 wins in 828 starts. The gap shows how win frequency, not just total starts or years in the sport, separates statistically elite drivers from long-tenured competitors (frcs.pro Driver Head-to-Head Tool).
Is there academic research on predicting NASCAR race outcomes?
Yes. A 2008 study published in The Sport Journal analyzed 14 races from the 2003 Winston Cup season, testing variables such as pole position, qualifying speed, practice time, team size, and prior-year points to see which best predicted finishing order. It remains one of the few peer-reviewed attempts at modeling NASCAR results with statistics.
What was the purse for the 2026 Brickyard 400?
The 2026 Brickyard 400, held July 26 at Indianapolis Motor Speedway as the 22nd of 36 season races, carried a total purse of $11,233,037. Purse figures like this get tracked alongside performance data to gauge how prize money lines up with driver and team standings across the season (Jayski.com).