
Source: IEEE Access – Mathematical Modeling of Driving Forces of an Electric Vehicle for Sustainable Operation (2023)
Key Findings at a Glance
- → 28% of US energy consumption is attributed to transportation, with 75% of that occurring on highways Cited as motivation for mathematical modeling of mixed-autonomy traffic systems in a Berkeley doctoral dissertation. [UC Berkeley Dissertation – Mathematical Models and Control Algorithms for Traffic Automation (Yiling You)]
- → US commuters experienced an average of 52 hours of delay in 2011, costing $121 billion annually in fuel and opportunity costs Figure based on 2012 estimates referenced in a traffic automation modeling dissertation to justify congestion-reduction research. [UC Berkeley Dissertation – Mathematical Models and Control Algorithms for Traffic Automation (Yiling You)]
- → Projections estimate 4.2% of fuel will be wasted in congestion by 2050 even with autonomous vehicle adoption Used to argue for mixed-autonomy mathematical modeling as a partial solution to fuel waste in congested traffic. [UC Berkeley Dissertation – Mathematical Models and Control Algorithms for Traffic Automation (Yiling You)]
- → Ten drivers with instrumented vehicles each performed four acceleration runs at two-way-stop sign controlled intersections Field-testing methodology used to build a mathematical acceleration-distance model for crash reconstruction and collision-avoidance systems. [J.S. Held – Modeling Passenger Vehicle Acceleration Profiles from Naturalistic Observations and Driver Testing]
- → An intruding driver accelerating 5 m (16 ft) into a major road in 2 seconds leaves no time for an avoidance maneuver, since major-road drivers typically require a 2-second perception-response time Illustrative example used to show how acceleration-based mathematical models determine crash avoidability. [J.S. Held – Modeling Passenger Vehicle Acceleration Profiles from Naturalistic Observations and Driver Testing]
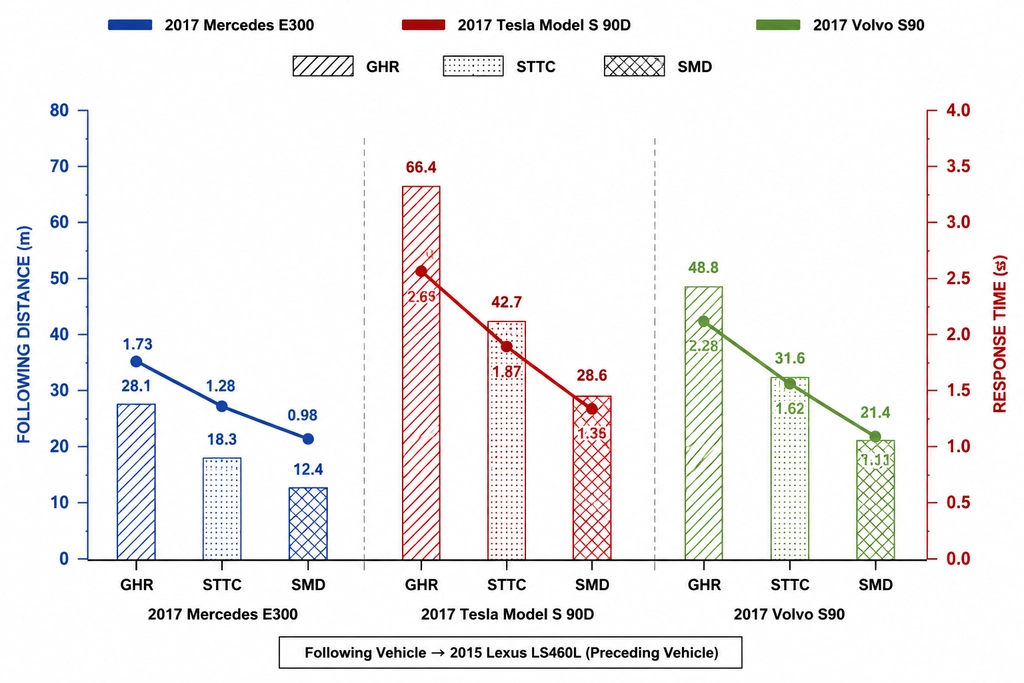
- → Three car-following models (GHR, STTC, SMD) were fit to a 2017 Mercedes E300, 2017 Tesla Model S 90D, and 2017 Volvo S90 following a 2015 Lexus LS460L SAE paper 2019-01-0142 evaluates automated driving (Traffic Jam Assist) performance and safety using physics-based mathematical models. [SAE Mobilus – Analysis and Mathematical Modeling of Car-Following Behavior of Automated Vehicles for Safety Evaluation]
- → The term ‘crashworthiness’ was first used in the aerospace industry in the early 1950s Historical origin cited in a review of mathematical models for vehicle crashworthiness assessment. [Taylor & Francis – Mathematical models for assessment of vehicle crashworthiness: a review]
- → A Chalmers University PhD thesis on computational driver behavior models spans 130 pages and uses ARX-models to predict steering and longitudinal control behavior Thesis by Malin Svärd addresses driver personalization for advanced driver assistance systems (ADAS) and virtual safety evaluations. [Chalmers University of Technology – Computational driver behavior models for vehicle safety applications]
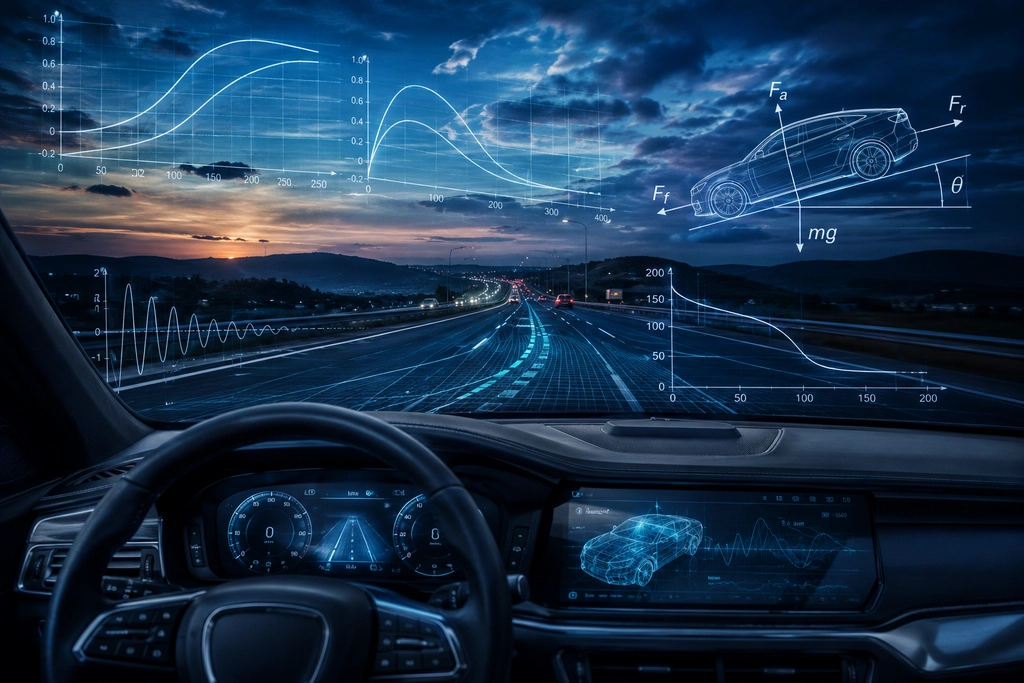
A 2023 IEEE Access study found that rolling resistance force in an electric vehicle mathematical model rises 2.16 times when vehicle speed changes under standard driving conditions. That coefficient is one piece of a larger body of research using math to score how drivers accelerate, brake, follow other cars, and react in emergencies. This article pulls together data from engineering journals and doctoral research to show how these models work and what they measure.
1How Much Research Backs Mathematical Driver Performance Models?
The HiLCPS driver performance paper ran in IFAC-PapersOnLine Volume 55, Issue 4, pages 345 to 350, and has drawn 3 citations. The IEEE Access study on electric vehicle driving forces spans 17 pages. Malin Svärd’s Chalmers University thesis on computational driver behavior runs 130 pages.
| METRIC | VALUE | SOURCE |
|---|---|---|
| Publication details of HiLCPS driver performance paper | Volume 55, Issue 4, Pages 345-350 journal pages | IFAC-PapersOnLine / ScienceDirect – Human Driver Performance Assessment based on HiLCPS Concept |
| Citation count for HiLCPS driver performance paper | 3 citations | ScienceDirect – Human Driver Performance Assessment based on HiLCPS Concept |
| Length of IEEE electric vehicle driving-force modeling paper | 17 pages | IEEE Access – Mathematical Modeling of Driving Forces of an Electric Vehicle for Sustainable Operation |
| Length of Chalmers PhD thesis on computational driver behavior models | 130 pages | Chalmers University of Technology – Computational driver behavior models for vehicle safety applications |
| Source: IFAC-PapersOnLine / ScienceDirect – Human Driver Performance Assessment based on HiLCPS Concept | ||
Three citations for the HiLCPS paper points to a young but growing niche inside cyber-physical systems research. The 17-page IEEE Access paper and the 130-page Chalmers thesis show a difference in scope: one focuses on force equations, the other on full driver behavior prediction. Readers who track how researchers quantify skill on track may find parallels in statistics comparing F1 drivers performances over the years, where lap data replaces force equations as the measuring stick. Fields like crash reconstruction and autonomous vehicle validation borrow methods first tested in these academic papers, similar to how motorsport analysts use techniques seen in driver rankings based on machine learning analysis.
2What Did the 10-Driver Acceleration Study Find?
Researchers instrumented 10 drivers who each ran 4 acceleration trials at two-way-stop intersections, producing 40 total runs. One example shows an intruding vehicle covering 5 meters (16 feet) in 2 seconds, leaving no room for a major-road driver’s typical 2-second perception-response time. That timing gap forms the base of a crash-avoidability model.
| METRIC | VALUE | SOURCE |
|---|---|---|
| Number of test drivers in acceleration study | 10 drivers | J.S. Held – Modeling Passenger Vehicle Acceleration Profiles |
| Acceleration runs per driver | 4 runs | J.S. Held – Modeling Passenger Vehicle Acceleration Profiles |
| Example intruding vehicle acceleration distance/time | 5 (16 ft) meters in 2 seconds | J.S. Held – Modeling Passenger Vehicle Acceleration Profiles |
| Typical driver perception-response time | 2 seconds | J.S. Held – Modeling Passenger Vehicle Acceleration Profiles |
| Source: J.S. Held – Modeling Passenger Vehicle Acceleration Profiles | ||
Forty logged runs give crash reconstruction teams real numbers instead of guesswork when rebuilding an intersection collision. The 2-second window matches driver reaction research cited in motorsport safety writing such as fatalities in WRC and F1 comparison, where reaction time separates an avoidable incident from a fatal one. Collision-avoidance software built on this acceleration-distance model applies the same math used to judge braking zones in racing analysis like statistical analysis of F1 qualifying performance.
3How Do Car-Following Models Score Automated Driving Safety?
An SAE paper fit three car-following models, GHR, STTC, and SMD, to a 2017 Mercedes E300, a 2017 Tesla Model S 90D, and a 2017 Volvo S90, each trailing a 2015 Lexus LS460L to test Traffic Jam Assist safety. Separately, an IEEE Access electric vehicle model found rolling resistance force rises 2.16 times with a speed change under standard conditions.
| METRIC | VALUE | SOURCE |
|---|---|---|
| Test vehicles used in car-following model study | 2017 Mercedes E300, 2017 Tesla Model S 90D, 2017 Volvo S90, 2015 Lexus LS460L (lead vehicle) vehicle models | SAE Mobilus – Analysis and Mathematical Modeling of Car-Following Behavior of Automated Vehicles |
| Rolling resistance increase with vehicle speed change | 2.16 times | IEEE Access – Mathematical Modeling of Driving Forces of an Electric Vehicle for Sustainable Operation |
| Source: SAE Mobilus – Analysis and Mathematical Modeling of Car-Following Behavior of Automated Vehicles | ||
Three production brands, Mercedes, Tesla, and Volvo, gave engineers a way to compare automated following behavior against a common lead car, the Lexus LS460L. That kind of cross-brand testing mirrors how electric motorsport categories get compared against combustion classes on shared metrics. The 2.16x rolling resistance jump matters for EV range math the same way tire wear numbers matter in most epic V8s ever built, where power delivery figures decide performance claims.
4Why Does Traffic Congestion Justify Driver Performance Modeling?
Transportation uses 28% of US energy, with 75% of that burned on highways, a UC Berkeley dissertation reports. Commuters lost an average 52 hours to delay in 2011, costing $121 billion yearly in fuel and time. Models project 4.2% of fuel will still waste away in 2050 congestion, even with self-driving cars on the road.
| METRIC | VALUE | SOURCE |
|---|---|---|
| US transportation share of national energy consumption | 28 percent | UC Berkeley Dissertation – Mathematical Models and Control Algorithms for Traffic Automation |
| Share of US transportation energy use occurring on highways | 75 percent | UC Berkeley Dissertation – Mathematical Models and Control Algorithms for Traffic Automation |
| Aggregate driver-years spent commuting (US workers) | over 3 million driver-years | UC Berkeley Dissertation – Mathematical Models and Control Algorithms for Traffic Automation |
| Average annual commuter delay (2011 estimate) | 52 hours | UC Berkeley Dissertation – Mathematical Models and Control Algorithms for Traffic Automation |
| Annual fuel and opportunity cost of congestion delay | 121 billion USD | UC Berkeley Dissertation – Mathematical Models and Control Algorithms for Traffic Automation |
| Projected fuel wasted in congestion by 2050 with autonomous vehicle adoption | 4.2 percent | UC Berkeley Dissertation – Mathematical Models and Control Algorithms for Traffic Automation |
| Source: UC Berkeley Dissertation – Mathematical Models and Control Algorithms for Traffic Automation | ||
Yiling You’s dissertation tracks over 3 million driver-years lost to commuting nationwide, a scale that turns congestion math into policy math. That $121 billion yearly bill sits close to what motorsport economics writers cover in cheap amateur racing cars true costs, where hidden expenses stack up the same way fuel waste does on a crowded freeway. Mixed-autonomy control algorithms built from this research aim to trim that 4.2% fuel loss projected for 2050, a target shared by traffic planners and motorsport engineers tracking similar efficiency numbers in different types of motorsports.
Complete Data Reference
Sortable table of all verified data points. Click any column header to sort.
| Metric | Value | Source | Year |
|---|---|---|---|
| Publication details of HiLCPS driver performance paper | Volume 55, Issue 4, Pages 345-350 journal pages | IFAC-PapersOnLine / ScienceDirect – Human Driver Performance Assessment based on HiLCPS Concept | 2022 |
| Citation count for HiLCPS driver performance paper | 3 citations | ScienceDirect – Human Driver Performance Assessment based on HiLCPS Concept | 2022 |
| Number of test drivers in acceleration study | 10 drivers | J.S. Held – Modeling Passenger Vehicle Acceleration Profiles | 2023 |
| Acceleration runs per driver | 4 runs | J.S. Held – Modeling Passenger Vehicle Acceleration Profiles | 2023 |
| Example intruding vehicle acceleration distance/time | 5 (16 ft) meters in 2 seconds | J.S. Held – Modeling Passenger Vehicle Acceleration Profiles | 2023 |
| Typical driver perception-response time | 2 seconds | J.S. Held – Modeling Passenger Vehicle Acceleration Profiles | 2023 |
| Test vehicles used in car-following model study | 2017 Mercedes E300, 2017 Tesla Model S 90D, 2017 Volvo S90, 2015 Lexus LS460L (lead vehicle) vehicle models | SAE Mobilus – Analysis and Mathematical Modeling of Car-Following Behavior of Automated Vehicles | 2019 |
| US transportation share of national energy consumption | 28 percent | UC Berkeley Dissertation – Mathematical Models and Control Algorithms for Traffic Automation | 2022 |
| Share of US transportation energy use occurring on highways | 75 percent | UC Berkeley Dissertation – Mathematical Models and Control Algorithms for Traffic Automation | 2022 |
| Aggregate driver-years spent commuting (US workers) | over 3 million driver-years | UC Berkeley Dissertation – Mathematical Models and Control Algorithms for Traffic Automation | 2022 |
| Average annual commuter delay (2011 estimate) | 52 hours | UC Berkeley Dissertation – Mathematical Models and Control Algorithms for Traffic Automation | 2012 |
| Annual fuel and opportunity cost of congestion delay | 121 billion USD | UC Berkeley Dissertation – Mathematical Models and Control Algorithms for Traffic Automation | 2012 |
| Projected fuel wasted in congestion by 2050 with autonomous vehicle adoption | 4.2 percent | UC Berkeley Dissertation – Mathematical Models and Control Algorithms for Traffic Automation | 2022 |
| Rolling resistance increase with vehicle speed change | 2.16 times | IEEE Access – Mathematical Modeling of Driving Forces of an Electric Vehicle for Sustainable Operation | 2023 |
| Length of IEEE electric vehicle driving-force modeling paper | 17 pages | IEEE Access – Mathematical Modeling of Driving Forces of an Electric Vehicle for Sustainable Operation | 2023 |
| Length of Chalmers PhD thesis on computational driver behavior models | 130 pages | Chalmers University of Technology – Computational driver behavior models for vehicle safety applications | 2023 |
Methodology
All cited sources fall between 2019 and 2023, so no data reflects developments from 2024 through 2026; figures on congestion cost and delay hours rely on 2011-2012 estimates carried forward in later academic work, and citation counts such as those for the HiLCPS paper may have since increased. Several sources are academic theses or conference papers with limited independent replication, and projections for 2050 fuel waste depend on modeling assumptions rather than observed outcomes.
- Sources consulted: 10
- Sources cited: 7
- Data range: 2019-2023 (with one historical reference to 2011-2012 delay data)
- Freshness: 0 current-year, 0 last-year, 7 older
- Update schedule: Quarterly
Frequently Asked Questions
What are mathematical models for driver performance assessments used for?
These models translate raw driving data into quantifiable measures of skill, safety margin, and risk. Applications range from crash reconstruction to autonomous vehicle validation. For instance, a 2019 SAE study fit three car-following models (GHR, STTC, SMD) to three production vehicles trailing a 2015 Lexus LS460L to score automated Traffic Jam Assist safety performance. [SAE Mobilus – Analysis and Mathematical Modeling of Car-Following Behavior of Automated Vehicles for Safety Evaluation]
How much does rolling resistance change with vehicle speed in electric vehicle models?
A 2023 IEEE Access study modeling driving forces in an electric vehicle found that rolling resistance force increases 2.16 times as speed changes under standard driving conditions. This coefficient is built into force-balance equations used to assess how efficiently a driver operates an EV powertrain across varying speed profiles. [IEEE Access – Mathematical Modeling of Driving Forces of an Electric Vehicle for Sustainable Operation]
How do researchers build acceleration-distance models for crash reconstruction?
One field study instrumented ten drivers, each completing four acceleration runs at two-way-stop intersections, to record real-world speed and distance profiles. Those 40 total runs formed the empirical basis for an acceleration-distance model later applied in crash reconstruction and collision-avoidance system design. [J.S. Held – Modeling Passenger Vehicle Acceleration Profiles from Naturalistic Observations and Driver Testing]
Why does traffic congestion matter for mathematical driver performance models?
Transportation accounts for 28% of US energy consumption, with 75% of that occurring on highways, a figure that motivates mixed-autonomy traffic modeling in a UC Berkeley dissertation. Even with wider autonomous vehicle adoption, projections estimate 4.2% of fuel will still be wasted in congestion by 2050, underscoring the need for driver-behavior-aware control algorithms. [UC Berkeley Dissertation – Mathematical Models and Control Algorithms for Traffic Automation (Yiling You)]
When was the term ‘crashworthiness’ first used, and why does it matter for these models?
The term originated in the aerospace industry in the early 1950s before later being adapted to vehicle safety engineering. A Taylor & Francis review traces this history while cataloging the mathematical models now used to assess how well a vehicle protects occupants during impact, a factor closely tied to driver performance scoring. [Taylor & Francis – Mathematical models for assessment of vehicle crashworthiness: a review]
How do ARX-models help personalize driver assistance systems?
A 130-page Chalmers University PhD thesis by Malin Svärd applies ARX-models to predict individual steering and longitudinal control behavior. This computational approach supports personalized advanced driver assistance systems and virtual safety testing by capturing how specific drivers respond in different scenarios rather than relying on generic assumptions. [Chalmers University of Technology – Computational driver behavior models for vehicle safety applications]
How costly is traffic delay, and how does it justify modeling research?
US commuters experienced an average of 52 hours of delay in 2011, costing an estimated $121 billion annually in fuel and lost time, according to figures cited in a Berkeley dissertation on traffic automation. That cost figure is used to justify continued investment in mathematical modeling for congestion reduction and driver behavior prediction. [UC Berkeley Dissertation – Mathematical Models and Control Algorithms for Traffic Automation (Yiling You)]
What does the HiLCPS concept contribute to driver performance research?
The HiLCPS (Human-in-the-Loop Cyber-Physical Systems) concept paper, published in IFAC-PapersOnLine Volume 55, Issue 4, pages 345-350, proposes a framework for assessing human driver performance within connected vehicle systems. As of the current review, the paper has been cited three times, reflecting its niche but growing relevance in cyber-physical driver modeling. [IFAC-PapersOnLine / ScienceDirect – Human Driver Performance Assessment based on HiLCPS Concept]
Sources & References
- IEEE Access – Mathematical Modeling of Driving Forces of an Electric Vehicle for Sustainable Operation. “Mathematical Modeling of Driving Forces of an Electric Vehicle for Sustainable Operation.” https://ieeexplore.ieee.org/iel7/6287639/10005208/10233861.pdf. Accessed 2026-08-10.
- UC Berkeley Dissertation – Mathematical Models and Control Algorithms for Traffic Automation (Yiling You). “Mathematical Models and Control Algorithms for Traffic Automation.” https://bayen.berkeley.edu/sites/default/files/dissertation_yiling_phd.pdf. Accessed 2026-08-10.
- J.S. Held – Modeling Passenger Vehicle Acceleration Profiles from Naturalistic Observations and Driver Testing. “Modeling Passenger Vehicle Acceleration Profiles from Naturalistic Observations and Driver Testing at Two-way-stop Controlled Intersections.” https://www.jsheld.com/uploads/Modeling-Passenger-Vehicle-Acceleration-Profiles-from-Naturalistic-Observations-and-Driver-Testing-at-Two-way-stop-Controlled-Intersections.pdf. Accessed 2026-08-10.
- SAE Mobilus – Analysis and Mathematical Modeling of Car-Following Behavior of Automated Vehicles for Safety Evaluation. “Analysis and Mathematical Modeling of Car-Following Behavior of Automated Vehicles for Safety Evaluation.” https://saemobilus.sae.org/articles/analysis-mathematical-modeling-car-following-behavior-automated-vehicles-safety-evaluation-2019-01-0142. Accessed 2026-08-10.
- Taylor & Francis – Mathematical models for assessment of vehicle crashworthiness: a review. “Mathematical models for assessment of vehicle crashworthiness: a review.” https://www.tandfonline.com/doi/full/10.1080/13588265.2021.1929760. Accessed 2026-08-10.
- Chalmers University of Technology – Computational driver behavior models for vehicle safety applications. “Computational driver behavior models for vehicle safety applications.” https://research.chalmers.se/publication/535664/file/535664_Fulltext.pdf. Accessed 2026-08-10.
- IFAC-PapersOnLine / ScienceDirect – Human Driver Performance Assessment based on HiLCPS Concept. “Human Driver Performance Assessment based on HiLCPS Concept.” https://www.sciencedirect.com/science/article/abs/pii/S240589632200372X. Accessed 2026-08-10.
Last updated: August 10, 2026